Great Depression 2 - Short trade of a Lifetime - preps start now

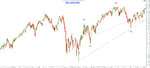
Dow Jones 15-min. timeframe (considered a loooooooong-term timeframe here at T2W)


your profit-taking boundaries are drawn (trendlines) and the magnificient supports that Dow follows to a T - this is why I love the Dow Jones - like God's Instrument, the EurUsd, the Dow contains the complete REACTIVE MIND of the HERD and therefore all the shenanigans are so easily visible on the PRICE chart -
one thing though, every now and then the Dow will switch to Arithmetic scale from Logarithmic, so its best to try both to get the right ONE.

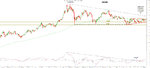
Lord help me, even on the 15-min frame the mighty Dow Jones does perfect touches of the Fibonacci supports. Currently at the 50% support HE IS TRYING TO SLINGSHOT and counfound all the shorters, hehehehehehehehehe. Deadbroke unloaded quite a nice pack of money here to pay his rent and buy some chow-mein. :):):D:D:D


A deadbroke gem :LOL::LOL::LOL::LOL:
 
A deadbroke gem :LOL::LOL::LOL::LOL:

Still with your idiotic predictions Deadbroke?? I guess one day at some point in the future the Dow will come down and you will remind us of how clever you were. That is of course after you promised to quit the thread twice....but never mind.....

See that you have moved now to "Olympic medal table" analysis. All I can say about it is that those analysis are as moronic and simplistic as your Dow analysis.

In the meantime, how is your P/L balance coming along with the Dow prediction?
 
A flaw uncovered in counting waves by reviewing both Quarterly and Monthly and then dropping down to daily to apply the technique (since waves are fractals the technique should be identical) ......

see chart for how I see the TOP aborning NOW with this change ....

so what will I do?

I will take the marginal overall Dow loss when Dow drops to around or below the 200-day m.a., this being close to or in the vicinity of the Dec 20 time period when I went wrong - in wave (iv) down as shown. Then I will go to the sidelines and time the (v) top and start all over with my SHORT.

The (iv) drop might or might not occur right away but it is in the cards even if we go higher than the very recent high a few days ago.

That is the plan, NOW.


Prescient post from March 5, 2012 outlining THE PLAN (modified albeit) is in full play. See the prescient wave labels drawn then, oh soooo valid still ....

Don't forget .... all losses were reversed and profits realized when we approached the 200-day ma.

So, to reiterate ... since the June 4, 2012 low we are now in the final wave v up. When this wave v is over, Fat Finger will show his face again to start the Great Depression 2 charge south with no further relenting.

One thing is for sure - once the CRASH begins, every rally will have the sissies claim the bottom is in. They will all die.

Only deadbroke and perhaps a few others will be able to call the final bottom - AND captialize on it.

deadbroke is watching this wave v up like a hawk - he knows it is the last hurrah.
 
A flaw uncovered in counting waves by reviewing both Quarterly and Monthly and then dropping down to daily to apply the technique (since waves are fractals the technique should be identical) ......

see chart for how I see the TOP aborning NOW with this change ....

so what will I do?

I will take the marginal overall Dow loss when Dow drops to around or below the 200-day m.a., this being close to or in the vicinity of the Dec 20 time period when I went wrong - in wave (iv) down as shown. Then I will go to the sidelines and time the (v) top and start all over with my SHORT.

The (iv) drop might or might not occur right away but it is in the cards even if we go higher than the very recent high a few days ago.

That is the plan, NOW.


Sorry, the chart does not show up from the quote on Page 42 of this thread, so here it is again with larger labels but essentially unchanged for the final upwave ....

The final subwave (v) might or might not exceed the (iii) top. Hardly matters but more significant to me if its a failed wave because we will get an even stronger Fat Finger.

The trendline shown is further exit strategy from any LONG to a decided SHORT.
 

Attachments

  • Dow Jones daily August 14-2012.jpg
    Dow Jones daily August 14-2012.jpg
    372.6 KB · Views: 265
How to play the greatest SHORT EVER .... ?

Remember that there will be loads of confusion and the exchanges will shut down and nobody will know who did what to whom so the best strategy is the deadybroke one - don't bother with smalltimeframe plays - they will sort it out and pay out correctly after some time.

So go in big before the effluvium and effluent burst the floodgates. Then just go to the beach and don't bother.

When wave one down completes - that will be days or weeks, take out the SHORT profits in FULL and retreat to a bear cave to enjoy your spoils for the duration of the tsunami. STAY IN CASH 100% from then on.

Do not b e tempted to to go LONG for the first major rally up - that rally is the setup for the next leg down which is the 3rd of 3rd, a particularly brutal wave, unrelenting and very much like the dead one, of particularly intemperate disposition.

It is during this 3rd of 3rd that banks and institutions will fail and all hell will break loose - that is why it is pointless to be SHORT then even though it is the highest earning wave for us. But we might not get paid.

That's my advice.

What to do with the spoils?

Join me at the venue below, ask for Cunny, his last name is Lin Gus, he will take you to me in Bangcock, Thighland.


Bangkok Dangerous - Bubble Toy - This One (DJ Shadow ReMix) - YouTube
 
Still with your idiotic predictions Deadbroke?? I guess one day at some point in the future the Dow will come down and you will remind us of how clever you were. That is of course after you promised to quit the thread twice....but never mind.....

See that you have moved now to "Olympic medal table" analysis. All I can say about it is that those analysis are as moronic and simplistic as your Dow analysis.

In the meantime, how is your P/L balance coming along with the Dow prediction?


Wir haben dein Land wieder gebumst. Als Ich in frankurt war, war es schon seit viele jahren aber jetzt ist alles scheisse. Deutschland wie Griechenland.
Entschukdigung, mein Deutsche ist so wie schlect wie mein dow Jones trading :):D:LOL::LOL::LOL::LOL::LOL:

Aber vor viele jahren konte ich fliessendess deutsch sprechen. :LOL::LOL::LOL::LOL:
 
Stop moved up to 12670. Plus 210 locked in. Target unchanged. Maximum offside 8 points. Dividends still coming in.

You don't need balls to trade, you just need to be right !

Stella


But YOU do have balls when you shouldn't and you do it with alternates which makes you Lord knows what - and because you're an elliottician your methods of deception are so well known that nobody even bothers anymore - most followers are dead anyways, all my friends died in the 2001-2005 with Elliottwave International's total loser calls.

But the dead people come back again and again because they have short memories. They are now dying again in droves and paying bigtime for that privelege.

Mark Hulbert has done an extensive study of the successful calls of Steve, Bob and the others in general. Read part 1 here, more can be found at Marketwatch website by using the search engine.


Lousy Track Record for Robert Prechter and Elliott Wave International | Les Jones

Elliottwave technicians are the biggest losers in Technical Analysis based trading. Doesn't mean one would auto start winning by leaving, but it does mean that one aveneue of certain death is closed forever.

I use it sparingly, mostly on Monthly - as one descends into the lower frames it gets progressivley more unreliable and even a mere trendline can lick it.
 
The HOUSING scene is just too much for the dead one to pass up .....

everywhere experts are chanting HOUSING has bottomed and is in a stable recovery.

Even the Case-Shiller is showing +ve signs. But the dead one would just love to call this master of disaster deception.

So here goes .... and its always in chartform ....

An example here for Stella Rogue as to how even though I do EW counts I care 2 hoots, bust my trendline and that's that. And even then I have an even more reliable method which shows the last low as the key breaking point - meaning if taken out we truly are in a reversal. But I believe the trendline shown will be the easiest arbiter.

Elliottwave counting, even though it looks so obvious here, is a crucccifixxxion personified - just plain unreliable.

Dead one has a rule about elliottwave and its even better than, "wave 4 cannot end in the territory of wave 1"

It is simple and says ..... the only way to do elliott right is to do it in hindsight - long after the move has completed - and dig this ... even then one never really knows if even that is RIGHT. :LOL::LOL::LOL::LOL::LOL:

Its a true circular motion with the right hand. Naturally Stella wouldn't know anything about this. :LOL::LOL::LOL:

:LOL::LOL::LOL::LOL::LOL::LOL::LOL:
 

Attachments

  • Home Construction Daily.jpg
    Home Construction Daily.jpg
    288.2 KB · Views: 230
Prescient post from March 5, 2012 outlining THE PLAN (modified albeit) is in full play. See the prescient wave labels drawn then, oh soooo valid still ....

Don't forget .... all losses were reversed and profits realized when we approached the 200-day ma.

So, to reiterate ... since the June 4, 2012 low we are now in the final wave v up. When this wave v is over, Fat Finger will show his face again to start the Great Depression 2 charge south with no further relenting.

One thing is for sure - once the CRASH begins, every rally will have the sissies claim the bottom is in. They will all die.

Only deadbroke and perhaps a few others will be able to call the final bottom - AND captialize on it.

deadbroke is watching this wave v up like a hawk - he knows it is the last hurrah.
Elliottwave counting, even though it looks so obvious here, is a crucccifixxxion personified - just plain unreliable.

Dead one has a rule about elliottwave and its even better than, "wave 4 cannot end in the territory of wave 1"

It is simple and says ..... the only way to do elliott right is to do it in hindsight - long after the move has completed - and dig this ... even then one never really knows if even that is RIGHT.
 
Dow Jones latest rally was called while it was in its infancy, aborning so to speak - and dig this, its still rallying. Dead one will call the end when he sees it.

A true HISTORIC top in the making. When the dead one calls the top there will be that 700+ point drop that I spoke about that will rival Fat Finger.

The Great Brits surely have forgotten Fat Finger. :LOL::LOL::LOL::LOL::LOL:

You could always go long while your waiting

Stella
 
Take the Dow Jones 60-min. timeframe SHORT on Trendline break.
 

Attachments

  • Dow 60 August 17-12.jpg
    Dow 60 August 17-12.jpg
    272.7 KB · Views: 219
The HOUSING scene is just too much for the dead one to pass up .....

everywhere experts are chanting HOUSING has bottomed and is in a stable recovery.

Even the Case-Shiller is showing +ve signs. But the dead one would just love to call this master of disaster deception.

So here goes .... and its always in chartform ....

An example here for Stella Rogue as to how even though I do EW counts I care 2 hoots, bust my trendline and that's that. And even then I have an even more reliable method which shows the last low as the key breaking point - meaning if taken out we truly are in a reversal. But I believe the trendline shown will be the easiest arbiter.

Elliottwave counting, even though it looks so obvious here, is a crucccifixxxion personified - just plain unreliable.

Dead one has a rule about elliottwave and its even better than, "wave 4 cannot end in the territory of wave 1"

It is simple and says ..... the only way to do elliott right is to do it in hindsight - long after the move has completed - and dig this ... even then one never really knows if even that is RIGHT. :LOL::LOL::LOL::LOL::LOL:

Its a true circular motion with the right hand. Naturally Stella wouldn't know anything about this. :LOL::LOL::LOL:

:LOL::LOL::LOL::LOL::LOL::LOL::LOL:


More HOUSING bottom callers ....

Is it time to get back into housing? - MarketWatch

--------------------------------------

deadbroke says HOUSING in topping mode for the rally from 2009. Next leg down in HOUSING will give deadbroke 10 cents on the dollar house purchases for his girlfriends in Thighland.


Something that the dead one notices on the Philadelphia Housing Index (^PHLX), then on the Home Construction Cats iTB, XHB and also on the REITS .... see towards right edge of chart for the consolidation before the upswing.

All HOUSING charts have the exact same valid uptrendline, the dead on'es arbiter but they all got something else too - they oughtta have every elliottician in existence jumping in glee because .........

the consolidation near the right edge is a wave 4, aka the penultimate wave in a sequence.

Compelling? Yes. But I said Elliott should only be on the back burner. Yeah. A trendline flogs Elliott easily.

Another thing about Elliott - when you start to trust it, it kills and maims, when you ignore it, it kills and maims. What's a fella to do? Stick to the basics.
 
You could always go long while your waiting

Stella


I could but if I did I would be you and others like you, all members of that noble group called the HERD.

And you being an Elliottician, even with your STOP, surely you can count the waves from the October 4, 2011 low? Its not often that the Market proffers something that obvious (= a trap? :):D)

Penny wise and ........... to even be LONG when you know that several months of LONG will be erased in 1-4 days on the SHORTSIDE when the reversal comes.
 
Gold is sooooo important in soooooo many respects that its worth pulling a deadbroke on Gold - why is this soooo important? Because if Gold blasts north again the entire DEFLATION scenario is dead and we will have some version of INFLATION, regular, super or hyper.

If Gold blasts south we gots DEFLATION which is the story of THIS THREAD.

Dig?
 
Dennis Gartman said today to ignore Gold's rally because it will continue to crash.

Deadbroke says, "take the 1H reversal that occurred earlier today and go with it, if it fails you can go short again - it is so close to major support that it could be a rally of substance"

Draw an uptrendline on 1H and place a mental STOP 1-3% below - risk some money. If wrong then on a reverse if the MASTER SUPPORT breaks one can recover the entire small loss in 10 seconds flat and then exponentialize it within each 1 minute of downside.

Living dangerously is the deadbroke way.

The trend is your friend has been forgotten by Gartman - the 1H trend that is.

On Daily it is absolute folly to be SHORT so close to major, major major support.

Just my 2 centavos.

:):):)


Original June 25th post #685 still ongoing ......

see the several posts since then mentioning the deadbroke vs Gartman scenario. Note that Gartman is already almost 2 months on the SHORT side while deadbroke is on the sidelines. My overall call for DEFLATION in this thread MUST have a CRASH in Gold to be a correct call - so in this regard Dennis and I are on the same call. But Dennis is a swing trader, sometimes swinging for weeks so his call is a short-term call (aeons for T2W traders to whom even 1 hour is an eternity)

His short-term call is already 6 weeks on the wrong side. But if impatience does not kill him, he might get lucky. See complete analy-sis on Gold that only deadbroke can do - in next post.
 
This chart will go down in HISTORY as the perfect view of the magnificent transition in Gold's TREND. Do we have only a bend with continuation north in the trend or is it a true reversal?

I'm on the sidelines because either way I look, I am unsure. therefore I must wait for the market to breakout one way or other. Naturally I am leaning south but am not willing to put money on that YET.

Chart descriptions sooooo sublime if I might say so myself - and I will, this will no doubt irritate the Brits. :LOL::LOL::LOL::LOL:


Macd showing a trendline breakout on June 13, 2012. But the breakout goes into a coil thereafter. Such coils tell of indecision and that is exactly my own condition. Can't decide which way the breakout will go.

Macd also above the 0-line is - this is very +ve for the northbound move. But to counter this, the histogram is showing very small bars so this is showing waning erection - Waning erection is common among Brits who cannot decide whether to love or hate Americans - but take them for granted, they dare not. :):D
 

Attachments

  • Gold daily August 10, 2012.jpg
    Gold daily August 10, 2012.jpg
    391.1 KB · Views: 218
Gold continued ......


Supports los magnificos @ $1580 and $1522 shown by the thick gold horizontal lines. As the perspicuous ones (none here but one never knows, maybe a Frenchy might read this) will note how nicely these go right thru' the AXIS OF THE FORMATION and although not shown, align perfectly with the grandaddy support system, THE FIBONACCI (38.2%, 50%, 61.8% and so on ....)

The gold supports above are soooooo strong that they are derived from the Weekly interface and shown thru' all the way to 5-min. timeframe for the premature ejaculators to trade.

Break these gold supports and DEFLATION goes into full rocket trajectory

As long as these supports stay firm it is total folly to go SHORT Goldie because these supports have tremendous latent coefficient of Restitution slingshot power - and if/when this latent energy FIRES, Gold will kill the Shorties so quick it will be mass burials in a jiffy.
 
Gold continued .....


One will also note that the 200-day moving average (green) has been broken by both PRICE and smaller moving averages (not shown in order to reduce thigs to a bare minimum). Institutions watch the 200-day like hawks and go SHORT once PRICE goes lower than it.

The large black triangle and the smaller red triangle tell of COILING on both a large scale and small scale. Indecision regardless how one looks at it.
 
Gold continued .....


Here's the supremely most magnificent feature of deadbroke's anal-ysis ....

THE TREND


The daily uptrend, regardless the huge sideways move since 2011 HAS NOT BROKEN ANY TREND FOUNDATION YET. Therefore the Daily TREND is still UP.
 

Attachments

  • Gold daily August 10, 2012.jpg
    Gold daily August 10, 2012.jpg
    391.1 KB · Views: 210
Top