You are using an out of date browser. It may not display this or other websites correctly.
You should upgrade or use an alternative browser.
You should upgrade or use an alternative browser.
Gold (XAU/USD) Technical Outlook by AliForexTalks
- Thread starter AliForexTalks
- Start date
- Watchers 13
AliForexTalks
Member
- Messages
- 57
- Likes
- 3
Gold Daily Outlook - Feb 28, 2022
In the last two days, XAU/USD has risen to a one-and-a-half-year high of $1,974.48 early Thursday, but has since fallen and has so far failed to cling to the $1900 level. It is worth noting that some investors are aware that the Russian Central Bank has some gold reserves and have booked profits ahead of the $2,000 mark, fearing that President Putin may use some of those reserves to support the Russian ruble.
Gold is trading with a bullish bias near $1,900 amid a surge in safe-haven appeal. The daily moving averages (DMAs) have a bullish slope and are located well below the XAU/USD spot price. This, combined with the breach of a nine-month-old downslope resistance trendline, fueled the uptrend, allowing gold bulls to reclaim the $1900 mark. XAU/USD first resistance would be $1,916. Breaching the latter will expose the January 2021 highs of $1,959, which, if cleared, could pave the way to $2,000. Good luck!
Farm Yard Forex
Well-known member
- Messages
- 395
- Likes
- 135
Couple of ways of looking at gold at the moment. It's a safe haven so people will flood into it and boost price. Flip side is that Russia has been buying up gold and with sanctions being imposed may look to sell it off to prop their economy up.
Jungletrader
Active member
- Messages
- 145
- Likes
- 23
Ahh really good point on Russia accumulation on Gold with a potential Selloff wonder what other assets they would look to hedge with
AliForexTalks
Member
- Messages
- 57
- Likes
- 3
Gold Daily Outlook - March 08, 2022
Gold prices justify the latest bearish Doji on the four-hour chart as they retreat from multi-day highs amid overbought RSI conditions. However, pullback moves will be difficult to come by until the quote defies last week's triangle breakout by falling below the previous resistance line of $1,928.
Ahead of that, the XAU/USD pullback may be tested by February's high of $1,967. If gold prices fall below $1,928, the $1,900 level and an ascending support line from late January near $1,890 will put bears to the test before handing over control. The 200-SMA level of $1,860 also acts as a downside filter.
Alternatively, the January-February 61.8 percent Fibonacci Expansion (FE) near the $2,000 psychological magnet tests the metal's immediate upside ahead of the theoretical target of last week's triangle breakout near $2,030. Following that, the peak near $2,077 in August 2020 will be in focus. Good luck!
It was all set to break out until Biden made his announcement.I think it's possible for Putin to go to a gold standard (Chinese CBDC backed by it) but he talked about not wanting to upset the world order as Russia was part of it but they might squeeze him and China too hard.We'll see.(I own a fair amount of Gold).

Last edited:
AliForexTalks
Member
- Messages
- 57
- Likes
- 3
Gold Daily Outlook - March 14, 2022
On an hourly basis, XAU/USD trades in a falling channel, indicating a lackluster move with a negative bias. At $1,975.40, the precious metal has found support near the 200-period Exponential Moving Average (EMA). The Relative Strength Index (RSI) (14) fluctuates between 40.00 and 60.00, indicating a back and forth movement in the precious metal ahead. On the bullish side, gold may find an immediate resistance at $1,980 and $1,995 levels, and a break above this can open further upward room until $2,011. Good luck!

On an hourly basis, XAU/USD trades in a falling channel, indicating a lackluster move with a negative bias. At $1,975.40, the precious metal has found support near the 200-period Exponential Moving Average (EMA). The Relative Strength Index (RSI) (14) fluctuates between 40.00 and 60.00, indicating a back and forth movement in the precious metal ahead. On the bullish side, gold may find an immediate resistance at $1,980 and $1,995 levels, and a break above this can open further upward room until $2,011. Good luck!
Farm Yard Forex
Well-known member
- Messages
- 395
- Likes
- 135
Price looks like it is just having a breather before a shot at the ATH to me. Sentiment and geopolitical climate should dry gold up as well.
AliForexTalks
Member
- Messages
- 57
- Likes
- 3
Gold Daily Outlook, March 24, 2022
The XAU/USD has broken out of the falling channel, sending gold prices near $1,945. The upper end of the falling channel is marked by the high of March 17 at $1,949.80, while the lower end is marked by the low of March 18 at $1,918.21. The Relative Strength Index (RSI) (14) oscillates between 60.00 and 80.00, indicating that the bullish trend is likely to continue. The 21-period Exponential Moving Average (EMA) of $1,937.15 will significantly support the counter. Good luck!

The XAU/USD has broken out of the falling channel, sending gold prices near $1,945. The upper end of the falling channel is marked by the high of March 17 at $1,949.80, while the lower end is marked by the low of March 18 at $1,918.21. The Relative Strength Index (RSI) (14) oscillates between 60.00 and 80.00, indicating that the bullish trend is likely to continue. The 21-period Exponential Moving Average (EMA) of $1,937.15 will significantly support the counter. Good luck!
Farm Yard Forex
Well-known member
- Messages
- 395
- Likes
- 135
I think this will come up to around 1969 into a gap and then retrace to around 1936 before the next leg up.
The area you marked as a level of support may hold the price and push the price towards the North. The H4 chart shows that the price has been heading towards the South with very good bearish momentum upon producing a Double Top. Thus, the buyers may wait to get a strong bullish reversal pattern as well before going long in Gold.
AliForexTalks
Member
- Messages
- 57
- Likes
- 3
Gold Daily Outlook - March 29, 2022
Although Friday's Doji candlestick on the daily chart suggests further gold declines, an eight-day-old rising trend channel limits the metal's short-term downside. However, the 200-SMA adds strength to the stated channel's support line near $1,925, while the 50-SMA around $1,937 limits the metal's immediate downside.
Meanwhile, recovery moves are dependent on a clear break above the $1,975 barrier, which is comprised of the stated channel's upper line and the 50% Fibonacci retracement level of late February to March upside. If gold prices rise above $1,975, the possibility of further gains towards the March 10 swing high near $2,010 cannot be ruled out. Good luck!
Attachments
Jungletrader
Active member
- Messages
- 145
- Likes
- 23
I can see an area of Demand just been tapped its game on for me longs initiated
momo3HC
Active member
- Messages
- 248
- Likes
- 66
Not so sensitive as we all are expecting. The begin of the war shown this.Tensions are easing in the war i wonder where the fundamentals will leave this next. It is so sensitive to external factors
AliForexTalks
Member
- Messages
- 57
- Likes
- 3
Gold Daily Outlook - June 06, 2022
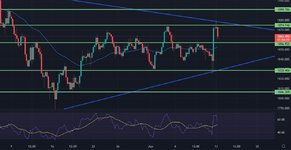
Gold made a strong bullish move to $1870; however, the uptrend was short-lived as the precious metal plunged to trade at the $1,853 level.
Closing of candles above the support level of $1,849 reinforces expectations of a continuation of the bullish trend, which primarily targets 1,870, noting that the price moves within a bullish channel, which supports the chances of exceeding the mentioned level to achieve additional gains on an intraday and short term basis.
The bull market trend scenario will generally stay operational and dominant in the coming sessions if prices remain above 1850 and 1838.10 levels. Today's trading range is expected to be between 1850 support and 1890 resistance. Good luck
AliForexTalks
Member
- Messages
- 57
- Likes
- 3
Gold Daily Outlook - June 13, 2022
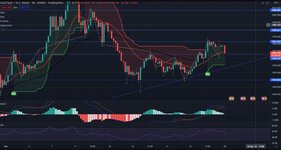
On a four-hour scale, the gold price is about to break out of its sustained consolidation formed in a scope of $1,825.10-1,876.01. The bullish momentum has been strengthened by a stronger responsive buying action noted last week from $1,825.10. The precious metal is bidding up from its 50-period Exponential Moving Average (EMA) of $1,853.15.
In the meantime, the Relative Strength Index (RSI) (14) has entered a bullish range of 60.00-80.00, adding to the upside filters. The gold price rallied strongly upwards to breach $1,850, paving the way for more expected gains on an intraday basis, activating the positive scenario that targets $1,890.00 as the next central station, noting that the continuation of the bullish wave is dependent on price stability above $1,850.00, and significantly above $1,838.10. Good luck!
Attachments
Similar threads
- Replies
- 0
- Views
- 469
- Replies
- 18
- Views
- 5K