I have been developing a technical analysis tool for some time and have posted some FX predictions and results on T2W in another thread. I call this analysis tool the Volatility Response Model for FX or VRMFX for short. The tool calculates support and resistance levels one day and one week into the future and short term trend channels (STTC) one day into the future and long term trend channels (LTTC) one week into the future.
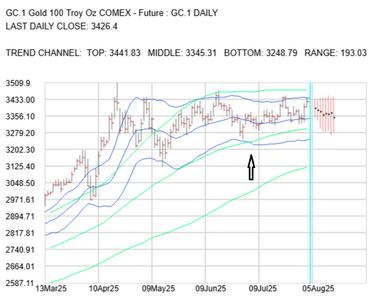
Recently I figured out how to use the tool for commodities and futures. So to reply to your question, I have attached below some VRMFX predictions for spot gold, COMEX front month gold future (currently the December contract), EURUSD and USDJPY for today 5th August.
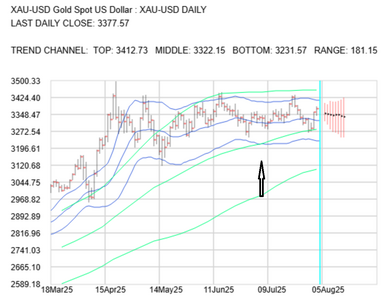
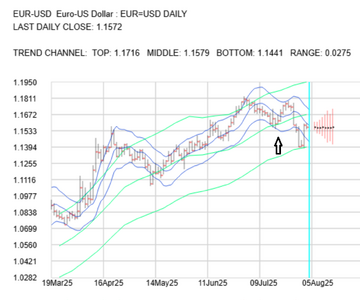
I always look at the STTC (shown top, middle and bottom in blue on the attached charts) and the LTTC (shown top, middle and bottom in green on the attached charts). The top, middle and bottom of the STTC bounce off and/or pass through the top middle and bottom of the LTTC. And the price action can also bounce off and pass through the top, middle and bottom of the STTC and LTTC. You can see the bounce of the EURUSD off the bottom of its LTTC for last Friday's August 1st US NFP.
I find that when a market is bullish in the short or long term then it will find support on the middle of the STTC or LTTC respectively. And vice-versa when a market is bearish in the short or long term then it will find resistance at the middle of the STTC or LTTC respectively.
So as you can imagine the STTC and LTTC for CL.1 and XAU-USD have been chasing the price action for some time. However recently the STTC of both has started to break down through the LTTC. I have marked the day when this happened on the charts with an arrow about the 4th July.
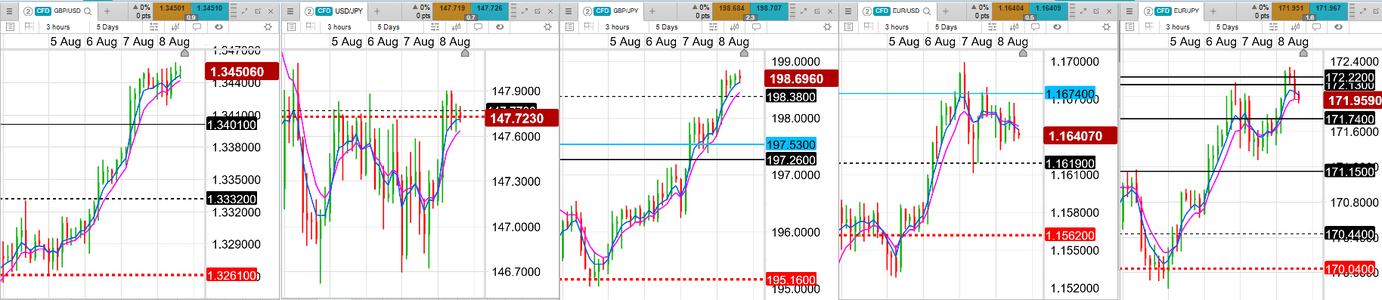
For EURUSD the bottom of its STTC broke down through the middle of its LTTC on the 16th July. The date is marked with an arrow on the chart. So EURUSD is currently long term bearish below the middle of its LTTC which is currently 1.1674.
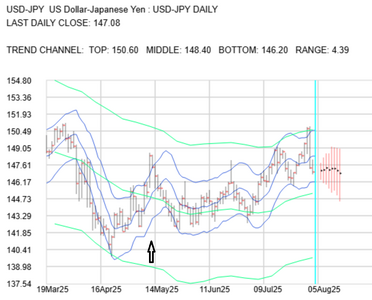
For USDJPY the middle of its STTC broke up through the middle of its LTTC on 12th May. The date is marked with an arrow on the chart. And its LTTC has slowly been starting to rise since that time. So USDJPY is currently long term bullish above the middle of its LTTC which is currently 145.20.
My take for EURUSD and USDJPY is that they are buying USDs. With the STTC falling through the LTTC for CL.1 and XAU-USD then gold is starting to be sold.
gka