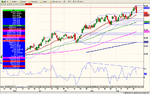
While probably too early to say (and still controversial considering bullish enthusiasm for gold), I do see some signals pointing to a reversal in the Goldstocks and its institutional leader NEM.
1. Momentum (see chart) and RSI waning
2. Massive Tweezer bearish engulfing pattern on daily chart.
Confirmation only comes below rising window in high 37's and break thru support at 26 Aug Bullish engulffing pattern at $36.5
By then other indicators will, no doubt, have waved red flags.
I am keen to hear your TA analyses/perspectives?
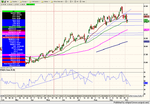