Dentalfloss
Legendary member
- Messages
- 63,404
- Likes
- 3,726
was out 1214 the low hit on May 9th...a day later from the postinggold in supp now
1224-1226 area
excellent rally from our supp area
was out 1214 the low hit on May 9th...a day later from the postinggold in supp now
1224-1226 area
1296-1315 mega rez area


AHH gold down 35$ . Good we took cautious note . I'm in sell for 1300$ . Currently it's trading at 1321
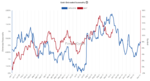
I usually make some cyclical analysis.
Since markets are usually positive at the end of the year, Gold should decrease from october to december.
Attached a chart showing a seasonal analysis for gold from 1970 to 2016 (blue line) and the current performance for this year (red line)