Dentalfloss
Legendary member
- Messages
- 63,404
- Likes
- 3,726
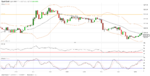
in rez now/prev supp area


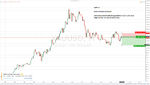
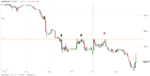
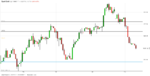
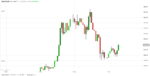
March 8th predicted chartHave a look at attached pic.
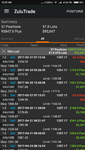
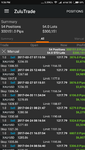
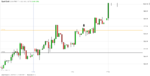
Xau USD shorts since 1275$ are open. We took 70 shorts initially. Now covered some of them , remaining 57 shorts are open. Pips are somewhere 97000 profits. In fx terms , one could say we are in 9,700 pips profit.
I run these trades in Client accounts . This prohibit me from exposing position real time
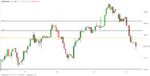
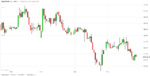
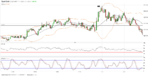
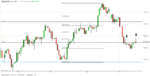
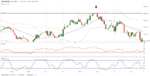
gold in supp now
1224-1226 area
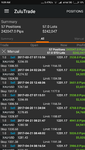
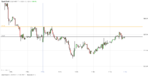
Update on 8 may 2017
Current price is 1230$
you still holding shorts with target of 1050?
can you post your analysis to show why that target?
Yes I am still holding the shorts .
I studied financial engineering and risk management recently.
There is this sentiment analysis of retail participants that trigger the reversal of prices. It does help a lot with identifying over bought or under bought areas.
Garch (1,1) analysis helps alot in such mathematical calculations.
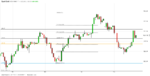
In simple terms I have put up a technical analysis chart few posts back. This crash was predicted back in march 8Th

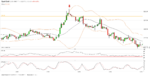
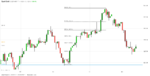
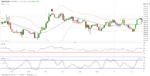
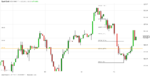
I see gold as being in major long term trend resistance going back to 2011:
It would have to pop through that and successful retest the old line before I decide long. But maybe I'm biased because I want gold to be cheap. This is all Trump's fault :whistling