Gold calls.Long term -medium term and intraday calls in gold is here !.

Calls/Signals provided by "sujithsstorock" have earned me profit ?

  • YES

    Votes: 51 36.4%
  • NO

    Votes: 89 63.6%

  • Total voters
    140
  • Poll closed .
gold

http://pcm-fx.com/forums/forum.php


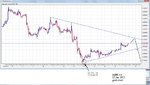
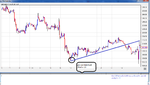
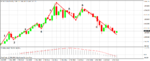
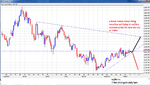
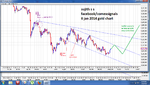
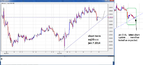
On the H4 TF, We were observing a reversal after having a harmonic pattern being formed. Currently the price is floating around conversion area as well as downtrend line. A Bullish push will be seen by having the trend line broken around $1220 area.


not so fast Robbie...
you might get burnt
its Burns night next month...
cos..the spike upwards on 10th december confuses the price action
in order to get a BETTER VEIW we track the close
p/f thrives on volatility
chart 1
$2.5 box size..res is showing at 1223 area
10s4sd4.gif


now if we increase the box size to $3..what do we get
1230 area..prev supp and trend res
r9oleb.gif
 
charts been lookin awesome

a closer look on the 30 min
box size is now $2 by 1 reversal
close
some wild stuff there
green horizontal is where we took the swing trade..a bounce then sideways until we positioned for the fed.the orange/internal trend can track it

i4kenq.gif

feel like we should at least have a big bounce around support , right it's gold after all. wondering if the money supply expansion kept buying up or something. im thinking golds a bubble and its gonna probably keep up. 1000 i think would be psychological support math implies we should be above 2000
 
Last edited:
a higher box s
15 min datai just to show where we are
alot of price action is compacted
10 december high to 20 dec supp
we are now at trend supp with horizontal supp below
note the move upwards just to test prev supp..that became res/light purple horizontal in 1216 /1218 area
so..next moves
a test of supp or break to test prev horizontal res..then above trend res at 1232 area
there will be other moves that test prev horizontal s/r

2lmx6if.gif
 
gold analayis, dec 27 2013...and jan 3 2014

check both charts to learnt he analysis.:clap:
 

Attachments

  • 27 dec.jpg
    27 dec.jpg
    63.8 KB · Views: 144
  • jan 3.png
    jan 3.png
    89.9 KB · Views: 154
january 6, 2014 gold analysis. bullish scenario with valid reasoning. valid only if 1150 $ is never broken
 

Attachments

  • jan 6 2014.png
    jan 6 2014.png
    147.6 KB · Views: 116
check out the chart work

checkout the chaart..gold predicted on 7 jan..and its playout on 8th jan.
 

Attachments

  • jan 8 update of previous date.png
    jan 8 update of previous date.png
    287.4 KB · Views: 127
This is how Elliott Wave Theory applies to recent price movement

I'd question your labelling of A and replace with 4, and that makes B a 5 which fits with the chart pattern a tad more, making this current leg down a possible A rather than C
all moot anyway as elliott wave is pretty useless. You just need to look at what Prechtor was saying about S&P and he wrote the book on it. So if he cant even get the counts right, what chance the rest of us!
 
outlook for next week
5 min data$2.5 box size by 3 reversal
close plot
trend cluster/green in 1235 area..trend supp
underneath there is horizontal supp going down to 1220
there is horizontal res/red at 1265 area and 1295 AREAS
there ia a double-top at 1255 area
lets see what happens...lots of horizontal supp areas down to 1180
14jysew.gif
 
spot gold 15 min over the last week shows 2 trends
$1.30 box size by 2 reversal hilo plot
note the 1244 pivot..horizontal red line
needs to stay above 1250 areato maintain that new uptrend
1261 trend res/purple trendline
lets see what happens

208ybnc.gif
 
lol...the 1261 minor res got blown out within a few minutes
lets look at the bigger picture
15 min data from new year
2 uptrends..green trendlines followed by a consolidation
then a fake / a breakout above the horizontal red line...shorts quickly sent it back into the supp area
then on 23rd/thursday the start of a new uptrend which then broke higher
emerging market debt possibly the reason for a true break and not another fake
so now we have a true uptrend to tack
fakes can be very profitable...dont seem to see them that often

dfdmbo.gif
 
OUTLOOK FOR NEXT WEEK
we go back to that latest uptrend and track it on the 5 min
areas to watch for signals
1.could break higher..light purple horizontal res at 1272 area
minor res /red horizontal at 1269
prev breakout point 1265 area thick dark red horizontal with trend supp
then a bigger confluence area at 1257 area..trendline and horizontal lilac lines
lets see
wgojo5.gif
 
analysis and result gold

jan 6 chart analysis, followed by jan 26..(y)
 

Attachments

  • jan 6.jpg
    jan 6.jpg
    94.9 KB · Views: 128
  • jan 26.png
    jan 26.png
    94.8 KB · Views: 144
  • jan 6 26 result.png
    jan 6 26 result.png
    172.3 KB · Views: 152
60 min data
1zn3f4i.gif

we could test trend supp
or break higher
some magnets at the horizontal red lines
 
Last edited:
hey Sujith..nice one..thnks
outllook for next week
30 min data tells us a few secrets
trend gets tested at 1253 area /green trendline
1246 area and we get the beginnings of negativity
res is horizontal red at 1274 and look left at 1288 area/orange horizontal
these are areas to take signals from..uneless big news and these break

2l9nuv4.gif
 
Top