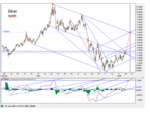
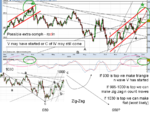
from a neutral perspective i see a reader is ryt now confused for sure in between bull n bear. 1600 or 600 $ ..n all. lets see history to prepare for future.
history>> suppose i meet u in year 2000 and ask u to buy gold at 200 $ then with stoploss 50 $ n tgt 1000 $ . tgt would have been met in 2008 . while prices were in 300-100 $ range for few years , its was from 2004 tht gold really started bull run..!!
present >> gold is at 930 $ . if i say today buy gold at 900 stoploss 330 $ tgt 3000 $ ???? well this is a call n it will take years to hit.but 3000 $ is a real possiblity in future n even 7000 $ as well. but tht call is not tradable call,thts a investment call. and in near term of this year most of us feel tht gold would nose dive till 600 $ minimum !! .now tht wont worry the investor as ur stoploss is 330 $ .
back up theory for 600 $
1) gaps... 1st one being at 750 . theory n history tell u tht never a gap would be let unfilled in any chart.
2)deflation ..US inflation figure is almost touching zero which indicates that there is no demand for dollars in the economy thus leading to deflationary and recessionary pressures
3) oil is down from 147 to 40 , gold is yet to do justice to melt down!!
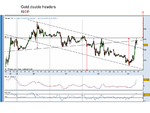
back up theory for 3000 $
1)devalyation of USD in future . USD once topped out i presume will fall till 24 one day
2)contrarian theory of AMERO . yes, myt come true
3)hyper inflation , today entire banks are cutting rates which would lead to tremendous cash flow into economy. cash will take time to make its path via banks to local mans hand n then inflation will kick in . (like oil fell. countries started taking steps to lower it from 147 $ , n it took few months before the actual affect started to show. but the steps taken were so harsh tht oil has fallen too much by its impact)
so nutshell is , look into stuff using MICROSCOPE for ST and TELESCOPE for LT . bull or bear... it depends upon from where u are looking at he picture !!
__________________