In his book "The Logical Trader," Mark Fisher describes a number of techniques to help his reader spot trend breakouts and identify their strength. Fisher's ACD trading system uses intraday data to identify the daily opening range for finding trades. Fisher, an independent trader, is the founder of MBF Clearing Corp., one of the largest clearing firms on the NYMEX.
While this intraday ACD technique may not appeal to the long-term trader or investor, the following is a look at how the technique can be applied to a longer time horizon.
Opening Range
In the article Spotting Breakouts as Easy as ACD, we look at how short-term trades are entered on a five-minute chart. Using the first five to 30 minutes of the day, depending on the equity or commodity, we determine the opening range (OR) high and low. "A ups" and "A downs" are then calculated based on a set number of points above or below the daily OR. In Figure 1 below, we examine the stock Broadcom. An A up (A down) (green lines) occurs if the price of the stock moves $0.27 above (or below) the OR.
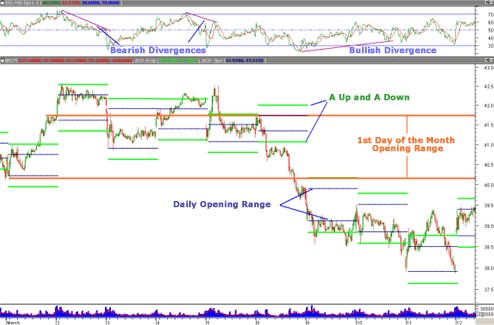
Fig 1: Source: MetaStock.com / eSignal.com
Monthly and Half-Yearly Opening Range
Opening range can also be applied to longer periods. Just as the daily OR has a greater chance than other times throughout the day of being the high or low, monthly OR has a greater chance than another day in the month of being the high or low for the next 20 or so trading days. Once the trader knows this fact, it can be exploited to better the odds of making money.
This is also true of the first two weeks (10 trading days) of each six-month period. The high and low set during the first two weeks of January and July often represent an important area of support or resistance for the next five and a half months.
The good news is that both monthly and half-yearly ORs are very easy to calculate. Simply take the high and the low of the first trading day of the month for the monthly OR, or take the first 10 trading days in January or July for the half-yearly OR and draw two lines across your chart. If price breaks above the high, a bullish bias is adopted. If it breaks below the low line, a bearish stance is taken.
Monthly opening range is plotted in Figure 1 (orange lines). We see that after breaking down through the monthly OR, the stock continued to trade lower, confirming a medium-term negative market bias. Advance warning of the breakdown was provided by the bearish divergence on the relative strength index, or RSI, in the upper window of the chart in Figure 1.
Pivot V and Pivot Range
Most experienced traders are familiar with pivots. A pivot point is simply the point at which a security changes direction and is therefore a turning point. A pivot low price bar has higher bars before and after it so that the formation looks like either a "V" or "U." A pivot high looks like the mirror image of a pivot low.
Pivots signify the end of a short-term move and minor reversal or the end of the dominant trend and a major change in direction. Pivot points are used to calculate Fibonacci levels of support and resistance, swing trade entry and exits, and in a host of other trading techniques.
A pivot range is also based on the high, low and close, but is calculated somewhat differently than a pivot point. As the name implies, pivot ranges have a high and low limit.
Here is the calculation from "The Logical Trader." The same formula is used to calculate daily, monthly and six-month pivot ranges, but note that for the monthly, the high, low and close of the first day of the month should be used. And for the six-month pivot ranges, the high, low and close of the first 10 trading days of January and July should be used:
- Pivot price (also equals formula for a pivot point) = (high + low + close) / 3
- Second number = (high + low) / 2
- Pivot differential = daily pivot price – second number
- Pivot range high = daily pivot price + pivot differential
- Pivot range low = daily pivot price – pivot differential
In Figure 2, the monthly (blue lines) and six-month (orange lines) pivot ranges are plotted for Broadcom. In both cases, the pivot ranges acted as either resistance (when in a bear trend) or support (bull trend).
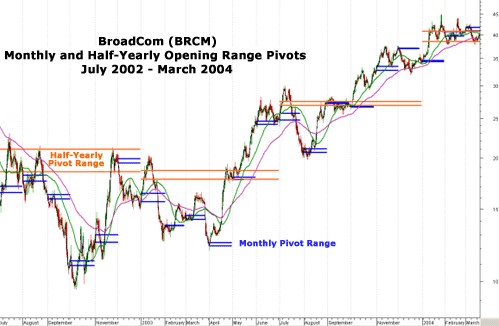
Fig 2 Source: Metastock.com / eSignal.com
Like opening range, pivot ranges can be used to execute trades. Similar to an ACD trade, A ups and downs as well as C ups and downs are used, but because the trader is using longer time frames, larger values are employed than when the daily values are calculated (not shown in Figure 2). When trading Broadcom, instead of using an A up of $0.27 to trade short-term using the daily OR, the longer-term trader would apply a half-year A up of $2.50 to $3 above the half-yearly pivot range, depending on volatility and stock price at the time.
The time frame is different but the concept is the same. The goal is to identify breakouts, assess their potential and then trade accordingly.
Three-Day Rolling Pivot
Another technique for helping traders spot breakouts is the three-day rolling pivot. When the three-day rolling pivot range is below the price action, long trades are favored and when above, short trades are preferred.
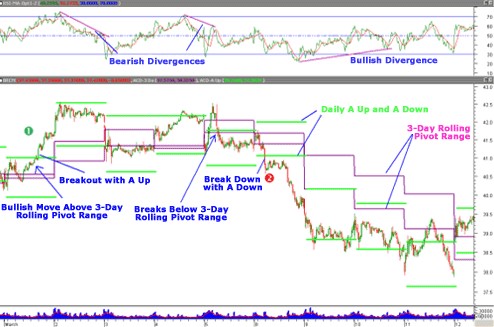
Fig 3 Source: Metastock.com / eSignal.com
In Figure 3, a buy signal is generated on Mar 1 (No. 1) when the price breaks through the A up. A long trade is further confirmed by the fact that the three-day rolling pivot is acting as support. The stock then begins to trade in a range in which the three-day rolling pivot turns from support to resistance by Mar 5. When the stock drops through the A down at point 2 on Mar 6, a sell is generated.
Here is the calculation for the three-day rolling pivot:
- Three-day rolling pivot price = (three-day high + three-day low + close) / 3
- Second number = (three-day high + three-day low) / 2
- Pivot differential = daily pivot price – second number
- Three-day rolling pivot range high = daily pivot price + pivot differential
- Three-day rolling pivot range low = daily pivot price – pivot differential
Putting It All Together
Fisher's point in "The Logical Trader" is that OR and pivot ranges are methods used by his professional traders to gauge overall market bias and are more powerful than simply relying on standard support and resistance. How are opening and pivot ranges used together?
- If OR < pivot range < close = plus day and the trader is bullish
For example, if OR is less than the pivot range and assuming there is some room between the A up and the pivot range, a long trade could still be taken. But fewer shares would be purchased, since the trader knows that the price has a strong probability of stopping or reversing when it reaches the pivot range. But when the price trades above the OR and pivot range, the trader has a higher degree of confidence that the trade has some room to move, so he or she buys more shares as it is now a plus day.
In Summary
Opening range provides a wider area with a probability that it will either be the high or the low of the period under examination. The pivot range, whether it is daily or half-yearly, gives another point of reference for support or resistance. By plotting these values on the chart, a trader can immediately see when the stock or market is gaining or losing strength and momentum.
Designating where OR and pivot range are in relation to each other and to the current price helps the trader decide how much confidence can be used when placing a trade. This information is highly useful in making trading decisions. And, like any reliable technical trading technique, it is one that works in all time frames.
Matt Blackman can be contacted at Trading Education