You are using an out of date browser. It may not display this or other websites correctly.
You should upgrade or use an alternative browser.
You should upgrade or use an alternative browser.
bbmac
Veteren member
- Messages
- 3,584
- Likes
- 789
Thanks to TheBramble for your analysis.
----------------------------------------------------------------------------------------------------
To the upside: 0523 is the prev week's hi with 0535 area this week/mth's current Hi of course.
Area of 0542-47 houses the highs from 18/7, 19/7, and 6/8. 0562 is 26/7 hi, and weekly cam H3 (break or bounce) pivot is at 0562. 0586/87 houses the hi's from 20/7 and 24/7 , with Wkly r1 pivot at 0600 in area of 23/7 hi at 0602.
0621 is 25/7hi and 0639 the Wkly M4 pivot. 0652 is the current yearly high and 0680 houses the Wkly r2 pivot and Mthly r1 pivot.
----------------------------------------------------------------------------------------------------
Earlier today MNI were taliking about some offers around 0525/30 ahead of a potentially stronger area at 0550/60 ahead of those yearly highs.
Those potential resistance become support (RBS) zones you mention are noted too by Mni, suggesting bids now in that 0450/40 region stronger at 0410/00, on any extended pullback.
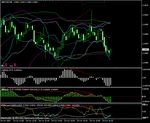
The screenshot shows the Daily resistance trend line now which should come in around 0525-30 tomorrow (weds.)
----------------------------------------------------------------------------------------------------
To the upside: 0523 is the prev week's hi with 0535 area this week/mth's current Hi of course.
Area of 0542-47 houses the highs from 18/7, 19/7, and 6/8. 0562 is 26/7 hi, and weekly cam H3 (break or bounce) pivot is at 0562. 0586/87 houses the hi's from 20/7 and 24/7 , with Wkly r1 pivot at 0600 in area of 23/7 hi at 0602.
0621 is 25/7hi and 0639 the Wkly M4 pivot. 0652 is the current yearly high and 0680 houses the Wkly r2 pivot and Mthly r1 pivot.
----------------------------------------------------------------------------------------------------
Earlier today MNI were taliking about some offers around 0525/30 ahead of a potentially stronger area at 0550/60 ahead of those yearly highs.
Those potential resistance become support (RBS) zones you mention are noted too by Mni, suggesting bids now in that 0450/40 region stronger at 0410/00, on any extended pullback.
The screenshot shows the Daily resistance trend line now which should come in around 0525-30 tomorrow (weds.)
Attachments
Last edited:
TheBramble
Legendary member
- Messages
- 8,394
- Likes
- 1,171
Oanda do a demo. But if you've already got TS running does it make any sense to get another platform....
TheBramble
Legendary member
- Messages
- 8,394
- Likes
- 1,171
Inner Bands 0476-0486.
Outer bands 0444-0518. Bear in mind ny previous post’s Support level at 0445…
I’m not taking the short as there’s too little to play for. I will wait for a reaction to the potential Support at 0445 and make a decision then either to go short if there’s a convincing momentum toward 0407, or if it’s turning, go Long to 0486, 0547 and maybe even 0655.
TheBramble
Legendary member
- Messages
- 8,394
- Likes
- 1,171
0445 indeed showing R/S tendencies. Looking at the momentum I don’t see it having the strength to go lower. I’m Long on a close above 0445. Initial stop 0422.
Targets as above.
Targets as above.
bbmac
Veteren member
- Messages
- 3,584
- Likes
- 789
Indeed Cable finding support at that last 1hr/30min/15min/5min RBS zone 0451-0398 of the move up yesterday, at o425 area.
Dly Pivot comes in at 0445 now and the asian/overnight range is 0468-0515.
Mni mentioning offers now 0475/85 which is the last 15/30min SBR zone of this small downside correction so far, more ahead of 0500 stronger toeward 0520.
Bids now likely at that 0420 area ahead of 0390/0405 they add.
Dly Pivot comes in at 0445 now and the asian/overnight range is 0468-0515.
Mni mentioning offers now 0475/85 which is the last 15/30min SBR zone of this small downside correction so far, more ahead of 0500 stronger toeward 0520.
Bids now likely at that 0420 area ahead of 0390/0405 they add.
bbmac
Veteren member
- Messages
- 3,584
- Likes
- 789
yeh, absolutely...great analysis/calls from TheBramble
Resistance found now ahead of those offers around 0500 area. Price action looks quite congested omn the 15min chart between this asian lo and hi 0469-0515 area. Price finding support now in the first 5min RBS zone of the renewed up move 0475-0461 being the higher high and higher low of that zone.
Dly R1 pivot comes in around 0568 with Dly r2 around 0638.
trendie
Legendary member
- Messages
- 6,875
- Likes
- 1,433
forget my frustrated rant y'day. 😱
new day. and I want another go at Sup/Res.
I will master sup/res. I will. will. I will.
excellent analysis from bbmac and ampro and TheBramble.
I am switching my "normal" trades to 4-hrs, and paper-trading sup/res till end of next week.
it might help if knew what your hit-rates are, so I dont feel so bad when I get skewered.
(I think I got myself into tunnel-thinking that the market was dropping, I locked myself into thinking that the previous support zones had become resistance. I failed to consider alternative options.)
bbmac
Veteren member
- Messages
- 3,584
- Likes
- 789
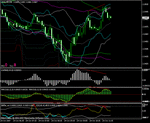
The attached 1hr chart shows that last RBS (resistance becomes support) zone on the move up which was a 1hr/30min/15min/5min zone...and the red lines show the hidden divergeence in the oscillators at that level with band deviation for good measure (10 and 20 bol, aqua and white.) It's what i term as a Reentry type 1, (there being 4 band/divergence patterns that i look for at identifiable potential SBR/RBS areas for trend re-entry.)
Trendie: RBS/SBR whilst a useful phenomenon in tech anlysis highlight only potential zones. so you really need some confirmation at those zones that they may indeed act as supp/res, such as the tech pattern attached. For me, the identification of supp/res/sbr/rbs potential is key and my chosen repeatable tech indicator based set-ups effectively give me the confidence to enter at those areas.
Trendie: RBS/SBR whilst a useful phenomenon in tech anlysis highlight only potential zones. so you really need some confirmation at those zones that they may indeed act as supp/res, such as the tech pattern attached. For me, the identification of supp/res/sbr/rbs potential is key and my chosen repeatable tech indicator based set-ups effectively give me the confidence to enter at those areas.
Attachments
bbmac
Veteren member
- Messages
- 3,584
- Likes
- 789
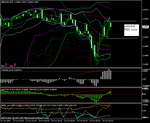
The screenshots attached show the 5min bearish divergence set-up at the 0505 level0509 tues european hi, 0506 Dly M3, offers up to 0520 area. The entry was confirmed by the 15min chart Reentry type 1 ie hidden divergence in the oscillators and the band deviation similar to the Hrly above down at 0425.
My point: you can use time frames to confirm each other. My set-up is the small intraday t/f's 1 5 and 30min. The second point, is that whilst it is likely that these areas and set-ups have a high strike rate, I have small targets generally (being on a 1min trigger) so I don't expect a home run of pips every time unless i deem it a significant swing point, particularly if against trend.
In this case the white lines on the 15min show the last 5/15m,in RBS zone and indeed price has found support in it now.
Attachments
bbmac
Veteren member
- Messages
- 3,584
- Likes
- 789
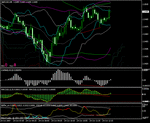
Now price finds support in the last 5 (arguably 15min) potential RBS zone with what i call a Reentry type 4 technical pattern confirm. Of course there is a double top on 5min above it but it failed to take out the higher low at bottom of that last RBS zone 0496-0469 (ie the last higher swing hi and higher swing lo on that time frame.)
I have to say i didn't take the set-up because of the double top above it, but was probably too cautious as the double top was only really on my 5min (intermediate) chart.
I have to say i didn't take the set-up because of the double top above it, but was probably too cautious as the double top was only really on my 5min (intermediate) chart.
Attachments
TheBramble
Legendary member
- Messages
- 8,394
- Likes
- 1,171
I took half my pos off after the 2nd attempt at 0500. Doesn't seem to want to play just yet.
Stop for remainder moved up to 0475 which a snip below the previous swing low (5 min) at 11:05.
Will load back up to full size on a re-test of 0500 from above, confirming Support.
Stop for remainder moved up to 0475 which a snip below the previous swing low (5 min) at 11:05.
Will load back up to full size on a re-test of 0500 from above, confirming Support.
TheBramble
Legendary member
- Messages
- 8,394
- Likes
- 1,171
Best laid plans...'they' must have heard me. 😆
Anyway...flat now and waiting to see what develops around this level. Still Bullish based on the technicals, but not enough to consider treating current action as a buyable dip.
Anyone have 0475 as a level in any timeframe? I can see 470 has 'also developed' today (and would have been a more sensible stop minus a few pips in retrospect) - that showing on anyone's radar in any timeframe?
shadowninja
Legendary member
- Messages
- 5,524
- Likes
- 645
I can see 470 has 'also developed' today (and would have been a more sensible stop minus a few pips in retrospect) - that showing on anyone's radar in any timeframe?
5 minutes timeframe. Acted as yesterday's support at around 2pm.
bbmac
Veteren member
- Messages
- 3,584
- Likes
- 789
0472 is the 38.2% fib of the move up from the bottom today, and the level falls at the bottom of that last 5min potential RBS zone 0496-0469, it being the asian lo at 0468/69 and 19/7 lo is in that area too. Its also a previous 4hr swing from 10/10....0469 was also a 5/15min potential SBr area ie a lower swing lo on the way down earlier today (shows best on 15min chart) other than that, nothing more
TheBramble
Legendary member
- Messages
- 8,394
- Likes
- 1,171
Thanks for the pointers chaps. Glad to be out given the downward drift, but it's a delight to know I can still make extremely basic mistakes. Like not noticing what the most recent price action (local S/R) was telling me.
Getting out with some loot is always good, and better than the alternative! But I'd rather have given away a little more and executed the trade more intelligently - if that makes sense.
Getting out with some loot is always good, and better than the alternative! But I'd rather have given away a little more and executed the trade more intelligently - if that makes sense.
bbmac
Veteren member
- Messages
- 3,584
- Likes
- 789
MNi latest talking about stops above 0505 failing to fire off leading to speculative bulls to cover short. Offers now 0505/0520 with stops mixed in which may provide momentum. Bids down to 0445 and again at that 0425 level stops below.
U.s Existing Home sales data due at 1400pm gmt....forecasts are mildly $ negative.
U.s Existing Home sales data due at 1400pm gmt....forecasts are mildly $ negative.
shadowninja
Legendary member
- Messages
- 5,524
- Likes
- 645
It's being an evil temptress at the moment.
bbmac
Veteren member
- Messages
- 3,584
- Likes
- 789
Done for the day
Knee jerk sell $ reaction to latest existing home sales data -8%, before a Reversal at that resistance zone just shy of yesterdays highs, but at yesterdays European highs 0509 area.
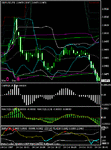
The screenshots are the 1m and 5min chart and although no real set-up to confirm the 1min Reversal Extreme set-up entry there was bearish divergence on both 5 and 15min chart, at that resistance area.
Seems the offers kicked in before any stops triggered had chance to add momentum. That said i would imagine most speculative short stops are above yesterdays highs.
Attachments
Similar threads
- Replies
- 24
- Views
- 14K
- Replies
- 0
- Views
- 2K


