You are using an out of date browser. It may not display this or other websites correctly.
You should upgrade or use an alternative browser.
You should upgrade or use an alternative browser.
there is another technique that can be adopted. Create a portfolio of derivatives, and take random positional bias using the smallest lot size. Then look at which biases are making money and which aren't, then readjust your trading to the direction the biases indicate.
current short term sentiment
bonds up
equities down
lumber down
crude up
vol up
gold up
yen up
basically inline with recession fears, oil and gold bucking the trend secondary geopolitical issues. Vol up, secondary to short term sentiment shift in equity markets, Yen moving inline with equities.
bonds up
equities down
lumber down
crude up
vol up
gold up
yen up
basically inline with recession fears, oil and gold bucking the trend secondary geopolitical issues. Vol up, secondary to short term sentiment shift in equity markets, Yen moving inline with equities.
n00b7r4d3r
Member
- Messages
- 50
- Likes
- 0
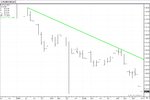
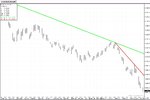
60 minute channel.
edit: so basically all the different timeframe probabilities are indicating down, the variance in price within the channel gives you probability indications, Ie if you go short at the bottom of the channel probability dictates that the variance within in the channel will kill your trade/stop. If you go short at the top of the channel, variance or probability dictates less likelyhood your stop gets hit, then at the bottom of the channel.
edit: so basically all the different timeframe probabilities are indicating down, the variance in price within the channel gives you probability indications, Ie if you go short at the bottom of the channel probability dictates that the variance within in the channel will kill your trade/stop. If you go short at the top of the channel, variance or probability dictates less likelyhood your stop gets hit, then at the bottom of the channel.
Attachments
n00b7r4d3r
Member
- Messages
- 50
- Likes
- 0
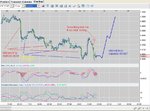
Were my observations about the MM's valid (except for the one about possible upside) or were they just random events that should not be read into.
if your trading 5 minute or shorter timeframes, each pair has its own personality. USDCAD trades very differently then does USDJPY. Plus the nature of the pair or the way it trades varies based on the timezone awake or participating in it at the moment.
Were my observations about the MM's valid (except for the one about possible upside) or were they just random events that should not be read into.
usually without seeing it in real time, its hard to say whether they are correct or not, but if your a speculator the shorter timeframes represent 'noise' in price with the overall trend.
also notice the sideways consolidative pattern, before it breakdown into a new leg.
what it implies is that the price or MM's are players churn it sideways and use a upcoming report or event to break it down further within the channel.
what it implies is that the price or MM's are players churn it sideways and use a upcoming report or event to break it down further within the channel.
the most immediate upcoming event is FOMC meeting, but lets look at the calendar... hold on.
http://www.forexfactory.com/calendar.php
n00b7r4d3r
Member
- Messages
- 50
- Likes
- 0
they are creating a false sence of bottom to cause retail to build up a long position?what it implies is that the price or MM's are players churn it sideways and use a upcoming report or event to break it down further within the channel.
they are creating a false sence of bottom to cause retail to build up a long position?
yeah basically, retail gets long trying to pick a bottom.
Similar threads
- Replies
- 0
- Views
- 9K
- Replies
- 0
- Views
- 777


