Sorry but this is total bull.
A chart doesn't show you where other traders are, who's on what side of the book and for what price.
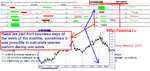
The only time I use charts is to murder chartist traders. For example you are reaching a resistence on a chart but looking at the order book no ones leaning, so instead of going short (like the chartists) I'll be loading the boat long, the big boys start dropping long ones big time and the stock price shoots up like a rocket, now all of those chartists are now buying shares off us, at a loss to them! You'd think the chartists would be away from their screens by then but no you then get more plonkers going long because they've seen a "breakout pattern" on their chart. Of course the big boys are now dropping short ones.
I've seen chartists getting hammered so many times simply because they are looking at their charts instead of the order book.
Seriously guys if you are new to this game, learn about the markets first. You need to see the full market depth aswell.
So to reiterate, if you want to make real money in the market, do not buy some crappy 5% a month automated system with 1000000 point stop loss, get your hands dirty and trade.
I know a post like this makes me out to be some kind of arrogant know it all, but I've tried every aspect of charting and none of it works, the support and resistence MAY work but you can never use it without looking at the order book.