FTSE100 - May 2005

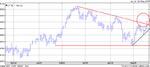
My opinions of FTSE are twofold

1) That it is in a down trend and

2) That it certainly hasn't happened to me this morning! Two lousy points are all I have to show- enough for
a continental breakfast in the bar across the street- except that it is lunchtime!
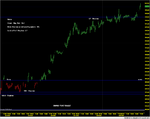
Split


This was to be a day when I was to take full advantage of a day off- Pentecost, I think , over here
 
barjon said:
Brackey my dear chap, nice to hear from you again.

At first read I thought you were talking about your ongoing work determining your set-up rather than our posts. I suppose you winkled 10 points or so out of the gap this morning ;)

Ban bracke does have a neat alliterative flavour but I wouldn't want to upset your many fans :devilish: .

good trading

jon

Your comment relating to my set-up is not so far off the mark. After some toing and froing I have got a set-up on paper which has been determined from analysing one share. I am now in the process of forward testing it on the share plus back testing it on other shares.

I will pointedly ignore your facetious comment relating to gaps.

Bravo bracke sounds better - two can play at alliteration.

Regards

bracke
 
split - well 2 points a day is over 400 a year :)

bracke - interesting, individual shares do have individual characteristics so even it it doesn't
translate to the wider audience it may still be worth it for that particular share. I've got
a pal who only ever trades one share - RBS - and he does ok.

jon
 
barjon said:
split - well 2 points a day is over 400 a year :)

bracke - interesting, individual shares do have individual characteristics so even it it doesn't
translate to the wider audience it may still be worth it for that particular share. I've got
a pal who only ever trades one share - RBS - and he does ok.

jon

You will find this hard to believe but the share that I have analysed is RBS!.

Does your friend use charts or fundamentals or a combination of both to trade RBS?

Regards

bracke
 
bracke said:
You will find this hard to believe but the share that I have analysed is RBS!.

Does your friend use charts or fundamentals or a combination of both to trade RBS?

Regards

bracke

bracke,

Bit of each. He uses fundamentals to determine whether it's cheap or expensive to set his long or short preference, then charts to take trades according to that preference.

regards

jon
 
Well, I've finished for the day. I went long at 1355 for 4878 but have got fed up with it and sold for 4879. so that's 3 points on the day.

You guys aren't index traders, are you? This is my third week because I was going nowhere with share trading. May I'll go back to it later because, although it can be done, the points gained trading the FTSE are about 27 to date over two weeks. I must not blame myself too much, the index is not going very far, either way.

Good trading

Split
 
barjon said:
bracke,

Bit of each. He uses fundamentals to determine whether it's cheap or expensive to set his long or short preference, then charts to take trades according to that preference.

regards

jon

Mine own set-up, which I will post when I have fully tested it, is based on support/resistance.

I am currently deciding which other shares I will test my set-up on. I am looking for those which oscillate between s/r on a regular basis but do not move much either side of it.

Regards

bracke
 
bracke said:
Mine own set-up, which I will post when I have fully tested it, is based on support/resistance.

I am currently deciding which other shares I will test my set-up on. I am looking for those which oscillate between s/r on a regular basis but do not move much either side of it.

Regards

bracke


over what timescale?
 
as far as i'm aware it looks that ftse100 is going up, at least upto the 4.990 area
 

Attachments

  • ftse100.png
    ftse100.png
    5.4 KB · Views: 246
mornin' all - good call Cecja.

Look what happens when you don't trust your system and second guess it :rolleyes: Got in a bit of a muddle when I got spooked out of a long when I'm supposed to wait for the close to confirm pattern breakdown (the arrows on the swing chart show where) because I got carried away by all those short triggers I'd been getting in my swing stable. Got a second bite of the cherry but I'm still kicking myself for a fool.

From a candle perspective, Thursdays near doji on high volume was negative but nullified by Friday's action, although that too printed a negative near doji. We are approaching the next resistance level around 5000, of course, and this might prove a difficult nut to crack. If there is a pullback I'd expect some support from Wednesday's long up candle but I won't be shaken out of favouring longs unless 4854 goes.

Good trading

jon
 

Attachments

  • ftseswing.gif
    ftseswing.gif
    10.8 KB · Views: 210
  • ftsecand.gif
    ftsecand.gif
    10.4 KB · Views: 221
Hi All

Charts Update

Sandra

PS - If anybody has any clue how to put intraday real time charts on this site - let me know

Sandra
 

Attachments

  • Ftse 230505.png
    Ftse 230505.png
    53.6 KB · Views: 222
sandrab said:
Hi All

Charts Update

Sandra

PS - If anybody has any clue how to put intraday real time charts on this site - let me know

Sandra

You need to change your chart extension from png to gif. I can't do it tonight but maybe I can give you a clue to look for yourself. Go to Yahoo and search for "giffy". This is a little programme (free) that you can download onto your disk and it will change your extension. It has the instructions.

With a bit of luck, when I come on tomorrow I will see that you have been successful.

Luck

Split

Split
 
Down I tell ya!

(or maybe up!)
 

Attachments

  • ftse.gif
    ftse.gif
    35.3 KB · Views: 221
mornin' all

wasp - mmm, well you're alright so far. :)

chris - mmm, strong break of the upper trendline though, so what any pullback looks like will be interesting. Another push to clear the gain line coming or was that around 8.45 the last try for the day?

good trading

jon
 

Attachments

  • ftseup.gif
    ftseup.gif
    14.3 KB · Views: 226
Hi All

Today's Update

S

Ftse Swing Intraday Post 4
 
Last edited:
Splitlink said:
You need to change your chart extension from png to gif. I can't do it tonight but maybe I can give you a clue to look for yourself. Go to Yahoo and search for "giffy". This is a little programme (free) that you can download onto your disk and it will change your extension. It has the instructions.

With a bit of luck, when I come on tomorrow I will see that you have been successful.

Luck

Split

Split


Hi

Downloaded Giffy - not able to convert file - Comes up with error. Any suggestions pls
 
sandrab said:
Hi

Downloaded Giffy - not able to convert file - Comes up with error. Any suggestions pls


sandrab,

Thats odd. The chart you posted yesterday could be opened ok or were you thinking of others? Doesn't really matter that it doesn't come through as a thumbnail.

What happens if you take your chart to paint and then try "save as" which should give you a range of options that are valid (see manage attachments). Or you can save as bmp then use giffy converter (that's what I do).

good trading

jon
 
The end is nigh

Evenin' all,

'Tis the end of the month and since there seems little interest I won't be starting a June thread unless anyone is particularly interested in seeing it kept going. Seems a shame as the monthly FTSE thread has been going without a break for a couple of years. Started by Bonsai and continued by Mully, then me with a bit of help from Bracke from time to time.

Anyway, where are we at the end? Monthly uptrend is still intact but it remains up against fib50% of the whole down move and up against resistance from that congestion area. The weekly and again the uptrend is intact with the price currently in no mans land. On the daily candles we found resistance from the April high and maybe a double top. Todays fall was a strong negative candle but it didn't quite make Thursday's low and there may be a bit of support from here as we're at that yellow minor support area. If that goes 4850 beckons with maybe a stutter around 4925/4900. The other way and 5000 still looks a tough nut to crack.

Finally, the swing chart is still running a long from around 4890 depending on entry criteria. Many will already have gone on the turnback from the April high - my stop's at 4957 so maybe the end IS nigh.

good trading everyone,

jon
 

Attachments

  • ftsemonth.gif
    ftsemonth.gif
    9.3 KB · Views: 191
  • ftseweek.gif
    ftseweek.gif
    9.7 KB · Views: 199
  • ftsecand.gif
    ftsecand.gif
    10.7 KB · Views: 191
  • ftsesw.gif
    ftsesw.gif
    10.7 KB · Views: 184
Top