FTSE100 July 2004

peterpr said:
We appear to be at something of a witching hour (or day or two).

I've had a look back to 1997 and can't find another occassion when the index was hovering a point or two above and below BOTH 200 and 50DMA's. My guess is that they will provide considerable resistance after a 3%+ move up in just 3 days.

If we do break above them then expect another surge up.

And that from someone who is essentially bearish about the short/medium term outlook for equities and believes we have already seen the years high.

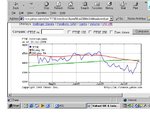
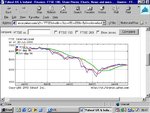
The 2 charts below may add to peterpr's observations

Regards

bracke
 

Attachments

  • untitled.jpg
    untitled.jpg
    63.3 KB · Views: 221
  • untitled.jpg2.jpg
    untitled.jpg2.jpg
    66.1 KB · Views: 241
mmm, on the cusp imo

The 4300 support area held which is positive. The rally was not accompanied by spectacular volume - suggesting limited supply rather than exuberant demand maybe? - and is hovering just above the fib50% level (the May/June rally stalled around fib62%). Interestingly, the March rally (which led to a new high) also put on over 100 points in four days which is not dramatically different. That (March) rally came after a 5.4% fall, this one after a 5.1% fall.

If the fib doesn't stop it, there's still a bit of air before we hit the downtrend supply line - and if that doesn't stop it the down trend comes into question and maybe a new high beckons.

Lastly, Friday's candlestick was slightly negative, but the mid point of Thursday's long white up candlestick held easily - if we start going south the first clue will come at this mid-point and it should be positive if it holds.

Next week looks interesting!! Trade it as comes - good hunting
 

Attachments

  • ftsew.gif
    ftsew.gif
    11.8 KB · Views: 253
mornin' all

getting closer to mid-point of Thursday's long white (388).

Bracke - leave you the honour of starting the August thread :)
 
Top