That diagram is as much use as a picture of spaghetti. Those trend/resisitance lines are not even going through highs/low - which dont include intraday hi/los.
In fact - here's my similar analysis of the FTSE...
That diagram is as much use as a picture of spaghetti. Those trend/resisitance lines are not even going through highs/low - which dont include intraday hi/los.
In fact - here's my similar analysis of the FTSE...
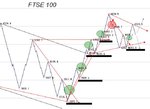
i think FTSE 100 may move down to 3800 or may be below to 3800. it seems that FTSE 100 making correction on weekly basis and start declining after touching 4600.
so from my view i think FTSE 100 will decline further more.