Forex Ideas & Comments

systematicfx

Junior member
Messages
46
Likes
2
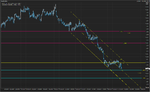
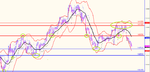
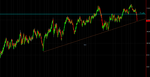
EURUSD: Short Term levels.
Support to watch 1.2805/10 - 1.2755 - 1.2665
Resistance: 1.2940/60 - 1.3000/35
To relieve the bearish pressure, we would need to go back above 1.2940/60 to test the more important 1.3000/35. Until then SELL rally ( ideally) with a S/L 1.2975 or 1.3055

Week End News:


  • Current proposed G20 growth measures would add 1.8 pct to global growth by 2018 - german g20 source
  • Germany's Schaeuble sees potential risk of bubbles in share and real estate markets - german g20 source
  • Schaeuble underlined need for structural reforms and consolidation to foster sustainable growth - german source
  • German fin min Schaeuble sees solid fiscal policy necessary to create room to act if risks materialize

Noyer says QE not on ECB agenda at the moment
  • ECB waiting for results of current stimulus steps
  • Noyer says euro zone "certainly not in deflation"
  • But inflation too low for too long is "is dangerous"
  • Weaker euro would be helpful to restore price stability
 

Attachments

  • EURUSD 20092014.png
    EURUSD 20092014.png
    56.5 KB · Views: 201
EUR/USD Update + Sup & Res Majors

EUR/USD TECHS-Candles reinforce bear view
1.2868 (Asia High) caps intraday for now. 1.2928 ( Friday high)
The lows from Friday at 1.2828 could come back under threat
Bearish engulfing weekly candle reinforces the short view
but watch day studies which are showing signs of a bounce
Target stays 1.2740 - look to lower the stop on a 1.2800 break
 

Attachments

  • Majors 22092014.png
    Majors 22092014.png
    63.2 KB · Views: 186
The trend lower in EURUSD continues and with inflation expectations continuing to drop I expect this trend to continue. 1.3000 above remains the big pivot which has survived both the FED and NFP, shorts can feel comfortable below there. I expect vol to continue to drift off in the short term now that the big events of last week are behind us. Watch Draghi speak this afternoon on an otherwise quiet event
 
EURUSD: Lower US yields just allowing the EUR room to stage a modest recovery but the underlying trend remains down for EUR/USD. Further macro fund short covering from the 1.2830 area and leverage accounts selling at the 1.2860-70 highs. For the day so far a 1.2826 to 1.2868 range. Large option expiries for today and the week ahead, totalling over 11-yards of EUR. Data wise a quiet start for the zone with just Italian industrial sales, remaining negative both m/m and y/y. Overall, a pause in the EUR drop with good support points, 1.2785 and 1.2740-50, plus optionality and a lack of fresh factors keeping EUR/USD contained early Monday.

13:30 GMT FRB Kansas City's George welcome remarks before community development conf
14:05 GMT FRB New York's Dudley speaks
23:30 GMT FRB Minneapolis's Kocherlakota on monetary policy; Marquette, MI
 
What was said today:


  • Fed’s Dudley dot plot doesn’t capture uncertainty of officials views, low inflation means economy remains slack, value of USD not a policy goal
  • Bank of Canada’s Wilkins cont’d monetary stimulus needed to return Canada to sustainable growth, premature withdrawal could undermine the expansion, has no target for USD/CAD
  • ECB’s Draghi Sep/Dec TLTRO’s should be assesses in combination, Structural reforms crucial
  • ECB’s Draghi will continue to remain expansionary, stress tests may have caused contraction in credit, exchange rate is not a policy target but is very important for price stability
  • ECB’s Praet need IMF to be more independent from political influence, perception is not correct that there is willingness to talk down the euro
  • Germany’s Merkel says sees France’s efforts, important to uphold EU budget rules but these are flexible
 
We might see some consolidation before the next move.
 

Attachments

  • consolidation.jpg
    consolidation.jpg
    97.3 KB · Views: 207
EUR/GBP continues its path lower and 0.7810 is a key support and a close below should gather downside momentum for a test of 0.7755. Any rally towards 0.7900 should find selling interest. We are keeping our core short.

Straight Cable is currently in a range trade. 1.6250 / 1.6475. A weekly close either side is needed to provide new direction. Customer’s interest has been light with a small skew towards purchasing GBP from the RM/Fund community.

NZD/USD made a marginally new low for the year after the cut in milk price. NZD should remain a sell on rally in the current USD environment. we remain short

  • NZ Fonterra cuts 2015/15 milk payout forecast to NZ$5.30/kg from NZ$6.00 on uncertain global outlook.
  • NZ Aug trade deficit unexpectedly narrows to Nzd 472m (f/c -1125m) amidst 6.9% rise in exports.
 
Few interesting chart:

Short Term Support & Resistance 25 Sep 2014
An interesting 3 year rate differential between US-Ger
Few levels to watch in cable. Pretty range bound for me. Better to be involved in EURGBP.
 

Attachments

  • Support & Resistance Majors 25092014-2.png
    Support & Resistance Majors 25092014-2.png
    688.9 KB · Views: 198
  • US German rate spread.png
    US German rate spread.png
    57.6 KB · Views: 177
  • GBPUSD 25092014.png
    GBPUSD 25092014.png
    68.2 KB · Views: 177
GBP/USD-Within strike of 1.6305-10 option expiries
--------------------------------------------------------------------------------
* USD bull trend may help prevent cable climbing too far pre-weekend
* 1.6333 (Asia high) & 1.6342 (Thurs high) among resistance levels
* Ascent to 1.6342 was fuelled by relatively hawkish Carney
* 1.6294 = subsequent pullback low. 1.6287 = early Europe low
* Support points include 1.6276 (Thurs low), 1.6267 & 1.6247
* 1.6305-10 option expiries today (closest-to-market)

EURGBP: Dip < 0.7800. potential P/T ahead of the week end.


EUR/USD TECHS-Target Bollinger base
--------------------------------------------------------------------------------
* A retest of the lows from yday at 1.2696 is favored next
* Base of Bollinger at 1.2677 supports mkt but a break is not ruled out
* Beyond sees 1.2502 = 76.4% of 1.2042-1.3995 (Jul 2012/May2014)
* New trend low yday keeps the bear bias alive and well
Some E 3.12 Yards in vanilla exp today 1.2750.
Dovish ECB expectations - Bias EUR lower.

AUD/USD: Still a struggle
---------------------------------------------------------------------------------
AUD still struggling overnight.
AUD New yearly low, taking barriers at 0.8750.
Sup: 0.8749 (Asia Low) 0.8659 (14 low)
Res: 0.8815 (pivot) 0.8884 (yday high)
Sell rally.
 
NZD/USD-0.7912 flips to resistance, RBNZ dominates
--------------------------------------------------------------------------------
* NZD/USD met headwind circa 0.7912 (Thurs low) after firming from 0.7886
* 0.7886 = early Europe 12mth low. 0.7957 = Asia high
* NZD continues to suffer on the back of RBNZ view
* AUD/NZD back at 1.11 (Thurs 2wk high) vs 1.0920 2mth low earlier this week
* RBNZ Aug FX data due Monday at 03:00GMT
* NZD/USD bear targets include 0.7750 & 0.7670 (Sept 2013 low)

OPTIONS-Larger DTCC expiries for NY cut
* AUD/USD: 0.8750 (301M), 0.8900 (136M)
* USD/CAD: 1.1045-50 (281M), 1.1100 (100M), 1.1165-75 (276M)
* EUR/USD: 1.2695 (512M), 1.2750 (2.69BLN), 1.2800-05 (650M)
* GBP/USD: 1.6305-10 (300M), 1.6475-80 (460M), 1.6500 (600M)
* EUR/GBP: 0.7750 (150M), 0.7870 (240M)
* USD/JPY: 108.30 (500M), 108.50-55 (435M), 109.50 (250M)
 
NZD/G10 Index

NZD/G10: This an index I created. NZD against the other G10 pairs. It s equally weighted. Just heading on the trend line support. Perhaps time for NZD to consolidate.
 

Attachments

  • NZ10 Index 29092014.png
    NZ10 Index 29092014.png
    97.8 KB · Views: 388
What will constitute a consolidation?

What would signal to you that it was not consolidating and how would you trade that?
 
What will constitute a consolidation?

What would signal to you that it was not consolidating and how would you trade that?

Plunge in dairy price, RBNZ moving from hike to pause and the intensified jawboning, which held out the threat of intervention, these are the main reasons as why the NZD lost ground

On the other hand,

We ve seen a 12% move since july peak ( highest 15%). Approaching 2013 low (which should hold the first test).
October Seasonal positive for the NZDUSD.
Excessive move down to low 0.7700's due to lack of liquidity.

Position wise: I trail my NZD short for the past 3 weeks or so. that was taken on a discretionary basis
Since today I entered a countertrend deal which is a very short term mean reverting model

I will be flexible and try to add to short on rally (keeping in mind the geo political tension ( Ukraine, HK, ISIS) + this week Econ data) knowing that any ease in the tension might bring back the market on "risk on" basis and help the NZD to recover.
My risk on,off indicator is reading a low 0.3/0.4 which is risk off mode.
 
So that NZD/G10 chart wouldn't play any part in your determination of whether NZD was consolidating or not?

You say you entered a countertrend trade today, presumably that's a Long on NZD? So you're now both long and short and you'll be adding to your short position if/when it starts to rally thus further eroding the value of your short position?

The NZD index has no part in any decision making.

The countertrend is part of a portfolio of strategies which basically compete for capital - different methodology, different time frame and is 100% systematic in the decision process.

The discretionary part of it is a separate portfolio and is just there to keep me busy.
 
The NZD index has no part in any decision making.
So why did you post it and theus imply it was a determinant in your decision making with respect to potential consolidation? This is what I mean about pointless graphics.

The countertrend is part of a portfolio of strategies which basically compete for capital - different methodology, different time frame and is 100% systematic in the decision process.

The discretionary part of it is a separate portfolio and is just there to keep me busy.
And this is what I mean about being unable to answer the simplest questions. You're buying countertrend (allegedly) and will also be selling into those rallies and thus eroding your short (alleged) position value?
 
So why did you post it and theus imply it was a determinant in your decision making with respect to potential consolidation? This is what I mean about pointless graphics.

And this is what I mean about being unable to answer the simplest questions. You're buying countertrend (allegedly) and will also be selling into those rallies and thus eroding your short (alleged) position value?


1) I don’t understand why a NZD ag a basket of currency is not a good idea.
It gives you a broad idea of the weakness/strength of a currency.
The chart was posted to show that the NZD index touched an important support and that if you were planning to sell ( following RBNZ heavy comments) perhaps it would be good to think twice or at least be cautious before selling the NZD at the lows and face a drawdown straight away.

2) I don’t see any problem to have 2 or more different methodologies uncorrelated trading together on different time frame. It brings diversification.

3) Re another threat:

Algos: Few banks now are offering “algos execution” as an alternative to human execution.

But overall top tier bank still have their spot desk as before. Less people of course, but focusing on managing the e-commerce and trade for their own account.

Others have separate desk for the ecommerce and fx trading.

It is pretty mixed but the old spot desk that you were laughing about is still up and running.

With the London fixing probe, more regulations will come and info flows through the Bloomberg channel and Reuters are being checked now. Among others that is one of the reason why the market has been quiet the past 6 months. A lot of funds were relying on banks “privilege information” to trade, Now that it s gone or almost gone.. the game is going to change
 

Attachments

  • agency execution.png
    agency execution.png
    185.8 KB · Views: 183
  • execution 2.png
    execution 2.png
    208.1 KB · Views: 189
Last edited:
USD/CAD-1.1225 option level under threat
--------------------------------------------------------------------------------
* Offers touted @ 1.1220 (1.1219 = Tues high; 1.1223 = Asia 7mth high)
* Option barriers @ 1.1225 & 1.1250 . 1.1236 = 0.89 in CAD/USD
* 1.1200 & 1.1225 option expiries today (closest-to-market)
* Key resistance @ 1.1279 (March's four-and-a-half year high)
* 1.1194 (pullback low from 1.1219) & 1.1178 (Mon high) are support points
* WTI oil suffered biggest daily drop since Nov 2012 Tuesday

NZD/USD-Fonterra event risk should keep lid on
----------------------------------------------------------------------------------
* Disappointing Fonterra dairy auction could spur fresh selling of NZD
* Result circa 1400GMT. Fonterra cut milk payout f/c last week
* 0.7821 (Asia high) & 0.7831 (Tues high) are NZD/USD resistance levels
* Spot was trading circa 0.7820/30 into RBNZ fx data Monday
* 0.7761 (Asia low), 0.7739 (Tues low) & 0.7708 (Mon low) are support levels
* Option barrier @ 0.7700. Key sub-figure support @ 0.7670 (Aug 2013 low)
 
Top