Forex Daily Bar

ffsear

Guest Author
Messages
2,304
Likes
550
Embarrassing because after 7 years of leaning to trade/trading I feel i should know the answer to this... but....

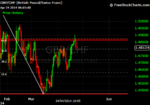
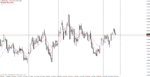
Is then an official closing time for the daily bar on forex markets. My charting software compared with my broker charts are showing different daily candle patterns.
 
Last edited:
I believe the usual close is taken to be 17:00 EST i.e. the New York close.
 
Can you tell me what your daily data is for GBP/CHF on Thuesday 22.04.14 with what ever you use..?

My charting package is showing...

Open: 1.48577
High: 1.49024
Low: 1.48565
Close: 1.48728
 
Can you tell me what your daily data is for GBP/CHF on Thuesday 22.04.14 with what ever you use..?

My charting package is showing...

Open: 1.48577
High: 1.49024
Low: 1.48565
Close: 1.48728
OANDA

Open: 1.4860
High: 1.4904
Low: 1.4858
Close: 1.4875
 
The above values are mid-points. Around the close the bid/ask spread widened to 7.4 pips on that day so true bid/ask was 4872/4879.
 
Turns out freestockcharts /worden close their daily bars at midnight EST! weird!

So the pinbar short i took on GBP/CHF this week was never actually a pinbar. Or was it?
 
Last edited:
This is interesting. Your epiphany regarding the potential ambiguity of cut-off point for forex was brought about by considering bar (or candle) structure. Mine was thinking about how daily support and resistance levels are calculated. I was looking at a number of indicators which provide the standard levels and found they didn’t all agree. The difference was which cut-off point each indicator developer considered to be the end of day. I had 4 slightly different sets of levels on the one chart when it dawned on me it could possibly work this way.

As with all things in technical analysis it is what the majority take as being the de facto standard that carries the most weight and that turned out to be the 17:00 EST timestamp and is the one I use, thankfully as do my charting and trading platform providers!

None of which helps me too much anyway as my recent record confirms.
 
So the pinbar short i took on GBP/CHF this week was never actually a pinbar. Or was it?
On both OANDA and MetaTrader served by Alpari, it wasn't a pin bar. The body was a significant portion of the range.
 
Hi ffsears and SD

I will try and explain how I see it with regards to looking at FX charts using candlesticks

From what i gather there are hundreds and even thousands of brokers around the world - many registered and regulated and then others that even form a "dark pool" - and are unregistered and probably you would not really be able to find out much about them - unless you are based in one of the 200 countries they reside.

Therefore if you are using their particular broker platform to trade from - the trading time zones will be different depending on where they are based on the World Map.

I understand that for years the US time zone was the main zone for setting daily opens and closes etc - but more recently its moved to the London UK time frame - simply because nowadays over 40% of all FX transaction are via the UK and less than 30% from the US - with the remaining from Europe, Asia and the rest of the world

You could therefore have say 50 traders based all over the world - all using different platforms - and all seeing different candle formations based on all time frames above 60 mins or 1 hr

If there are millions of retail traders around the World - they could be looking at 4 different 4 hr chart formations - all depending on the charts time zone settings

The only time frames that all around the world see as the same set up are 60 mins and under - ie tick - 1 min 15 / 30 /45 mins etc charts.

Then if you throw in the fact that many brokers use time delays and might follow 1 to 30 + seconds behind what the Banks and the liquidity providers are using - no wonder we will always see differences in highs and lows by normally 1- 5 pips.

Anything above 5 pips really is not acceptable - but 1 to 3 pips is normally taken for granted - and as a trader you are only interested in your own platform prices - ie the broker price feed you use - as anyone else's prices are really of no real use to what you obtain off any win or loss trade.

Its probably one of the reasons we as traders - all see different trades - as we are not all "singing off the same song sheet" ;-)

Personally - I have used yearly - quarterly - monthly/ weekly / daily charts etc - to see the big picture view - before drilling down to the "now" charts to find out what might happen next. I would never just trade off just 1 or 2 indicators ( including candle stick patterns) etc - for me I look for ideally 5 main clues and need at least 3 "clues" to think about a buy or a sell. Its ok thinking a nice pin bar off a weekly or monthly is good enough for a trade - but really as we have already mentioned in another thread - most indicators in isolation - over 100's or 1000's of trade will normally only give you 50 /50 results. I know that's good enough to make money with proper money management - but on monthly or weekly charts - do you really want to wait days or even weeks to find out your trade as just been stopped out for 150 or 200 pips ??

Hope that helps and please correct me if you have different information etc on what I have said - because as most of us know - to find out everything about the FX markets is very difficult - even many of commercial institutions and regulators don't seem to know all that is happening ;-)


Regards


F
 
Cheers FX, its why i have always traded exclusively off the Daily and Hourly bars, because (i thought) they were the only true universal time frames (of the longer ones), where 2 hours, 4 hours etc etc can be subjective.

Looks like i'm gonna change charting package. Thinking of ShareScope
 
Last edited:
On both OANDA and MetaTrader served by Alpari, it wasn't a pin bar. The body was a significant portion of the range.

Yep, see this is what mine showed. Yet I checked Alpari on MT4 and its a totally different pattern.

Still took a short at .4846, however i won't be using FSC again
 

Attachments

  • yep.png
    yep.png
    22.9 KB · Views: 162
Last edited:
Just use New York Bankers Close time . 5pm est. I have used this for yrs.

This is an extremely important why you need to be using New York Close Forex Charts to effectively trade the price action strategies .
The daily close of the Forex market takes place at 4:59:59 pm NY time and signals the end of the current Forex trading day and the start of the new one which occurs at 5pm NY time as New Zealand / Australia and Asia trading gets underway. The New York close also reflects the close of the 2nd heaviest Forex trading session which is the New York session.

Closing prices are the most important in any market because they reflect who won the battle between the bulls and bears for that session. Also, as a price action trader focusing on the daily chart, we need to see the price action setup close out on the daily chart before we can correctly identify it as a price action signal, and it’s at the daily chart close that many significant price action setups form.

Another thing is if you are using pivots etc they calculate different to different closing times.
 

Attachments

  • gbpchf.xpdaily ny close.png
    gbpchf.xpdaily ny close.png
    70.9 KB · Views: 189
Last edited:
Thanks for that patong. I've actually copied part of you post and used that in my request to worden that they change the time of the closing of the daily bars.

Its a shame because there software is fantastic, however, as FXMO says, I want to be singing off the same sheet as the rest of the market. (well most of them anyway!)

Cheers

Notsure if its that difficult to get them to change the chart time. I opened a live account with SynergyFX on the condition they had to change the chart time. They also said many other traders requested it also.
 
Great news for Australian MT4 traders! On 9 May 2014, FXCM is upgrading our MT4 server to the New York close charts. By shaving a few hours off the weekly charts, you’ll have five true candles for five trading days.

How You Benefit

Your charts will follow the industry standard
Indicators on daily candles will be even more accurate
Easily follow the signals of popular trading groups
The New York close charts begin when trading opens 12 May 2014. Unless your EAs, indicators and other apps close on GMT time, you shouldn’t have to make any adjustments on your MT4 platform. Read our FAQ.

Happy Trading,

FXCM Australia Limited
Suite 2, Level 18
420 George Street
Sydney, NSW 2000
 
Top