Flags, Pennants - my interpretation

rsd886647

Well-known member
Messages
265
Likes
3
Hello,

I'd like to post my strategy, which utilises flags and pennants, although I have probably bent the rules a little and so would like some feedback on whether what I am doing is valid. Thanks.

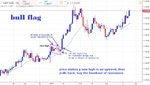
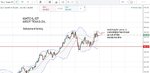
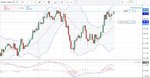
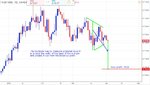
In this first trade, price was in an uptrend, a new high formed, then price pulled back in a flag-type formation (a pole was in evidence). I like it when price action accompanies these signals and here we had a small pin bar at the end of the retracement. Buying the breakout of resistance would prove to be a good move.

Rob
 

Attachments

  • gbpusdt2w.jpg
    gbpusdt2w.jpg
    138.5 KB · Views: 502
Bund bull flag

In another example of a bull flag (my interpretation), on the German Bund chart, we can see perhaps the start of an uptrend, there must be at least one month's of buying for me to consider a signal.

Would appreciate your feedback.
 

Attachments

  • bundt2w.jpg
    bundt2w.jpg
    158.7 KB · Views: 475
Nzdusd pennant

Another example, this time of a pennant.
 

Attachments

  • nzdusdt2w.jpg
    nzdusdt2w.jpg
    166.5 KB · Views: 436
Bear flag - usdchf

And just to complete the set, a bear flag. Would like to hear any comments you wish to make. Thanks.
 

Attachments

  • usdchft2w.jpg
    usdchft2w.jpg
    144 KB · Views: 446
Cool... but i think these are also simply examples of nicely trending periods where jumping in on a pullback was always going to be sweet if you followed a sound plan :)
 
Cool... but i think these are also simply examples of nicely trending periods where jumping in on a pullback was always going to be sweet if you followed a sound plan :)

Thanks Kaeso for commenting. I would say that the Bund and Nzdusd trades were at the start of the trend. One that isn't is West Texas Oil, which I am looking at now. Post to follow.
 
West Texas Oil - a signal forming???

This may or may not eventuate, but it is on my watchlist for now.

Comments welcomed.
 

Attachments

  • wtot2w.jpg
    wtot2w.jpg
    117.5 KB · Views: 431
This may or may not eventuate, but it is on my watchlist for now.

Comments welcomed.

Entry is only one component in the overall equation. What is your exit plan, is it some form of trailing or measured move? Take for example, the NZDUSD trade - what was the overall trade plan?
 
Hi Brumby,

Thanks for the question. If I can use a previous Bund trade, because I am currently in a trade on this chart, this is my exit plan...I should add that I will also monitor the MacD for signs of trend exhaustion if I am say up by 5x my risk, and may exit manually in that scenario.
 

Attachments

  • bundt2w2.jpg
    bundt2w2.jpg
    223.9 KB · Views: 465
Hi Brumby,

Thanks for the question. If I can use a previous Bund trade, because I am currently in a trade on this chart, this is my exit plan...I should add that I will also monitor the MacD for signs of trend exhaustion if I am say up by 5x my risk, and may exit manually in that scenario.

Cool. Was the BB cross only a partial exit since you mentioned that you still have an open position? What is the trade plan on the remaining position?
 
Hi Brumby,

Sorry, I did not explain well. My example was a past trade. I am now in a new trade as shown on my first page. I am nearly 2xR up. I will trail my stop, moving to breakeven hopefully when the markets are open again. Thanks for the question though.

Rob
 
A signal - Brent Crude Oil

I did have West Texas Oil on my watchlist and posted a chart here in this thread, but that signal is not as developed as this Brent Crude Oil signal, which looks ready to go.
I will look to trade this signal instead IF it breaks up past where my buy stop will be.
 

Attachments

  • brentco3103.jpg
    brentco3103.jpg
    161.1 KB · Views: 421
Wedge pattern

A new pattern I will be looking to trade as and when I see it is the wedge pattern, as a continuation of trend. It is similar to a flag pattern and I will set a take profit of 1:2 should I make a trade. This is an example of it:
 

Attachments

  • audusd0204.jpg
    audusd0204.jpg
    192.5 KB · Views: 408
I've spotted a triangle that formed before my Brent Crude Oil bull flag trade, this would have been a better entry. I hope there's still bullish momentum in this market.
 

Attachments

  • brent0204.jpg
    brent0204.jpg
    199.1 KB · Views: 504
Trade triggered - Brent Crude Oil

I'm now long.
 

Attachments

  • bco0204.jpg
    bco0204.jpg
    155.9 KB · Views: 439
1R loss

I took a hit!

I have amended my plan because I normally like to see 2 months of selling pressure before a bull flag signal forms (after one month + of buying/consolidation). This was part of my original plan and I moved away from it, but I think it's an important element. There was not this selling prior to the Brent Crude Oil flag trade. That doesn't mean it will always work, but it's now definitely part of my trading plan going forward.

I'll show what I mean below:
 

Attachments

  • nu.jpg
    nu.jpg
    117.2 KB · Views: 443
A signal - Triangle (NZDUSD)

I've recently learned about triangles so I'm putting into practice some of that. I'm developing my plan as I go, so the ride could be a bit bumpy.
 

Attachments

  • nu0304.jpg
    nu0304.jpg
    141.5 KB · Views: 446
Take profit target - NZDUSD

I'm probably posting stuff people already know, but it reinforces my learning.
 

Attachments

  • nutextb.jpg
    nutextb.jpg
    113.8 KB · Views: 413
I should have had a sell stop a bit lower down on the nzdusd trade, wait for the breakout to be significant, instead I've got caught on the wrong side of the market again. I will keep my position open and hope for price to drop in the coming days.
 
Top