A detailed step by step guide of how to trade a falling wedge has been illustrated in a free video, to view it please click on the following link
http://www.4x4u.net/review/51/51.html
Key aspects of a falling wedge are summarised as follows;
A Wedge formation is similar to a triangle in appearance in that they have converging trendlines. A falling wedge is generally a bullish chart pattern that begins wide at the top and contracts as the prices move lower. This pattern has a series of lower highs and lower lows.
The following chart on EURGBP (Nov2006) illustrates a good example of a falling wedge, and this was covered live at one of my live Webinar enabling traders to pull the trigger, thus far it has been a very good profitable trade.
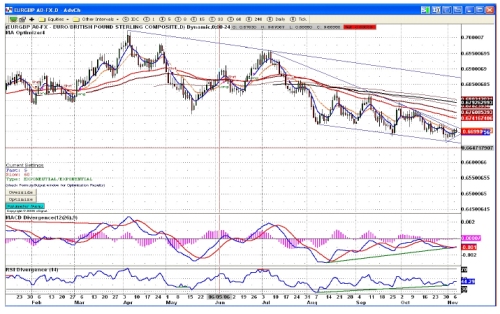
caption: Charts by Esignal.com
The bullish bias is generally realised when there is a break of the resistance line. However, often aggressive traders are able to get in early provided there are a number of confluences of indicators, in the above chart you have a perfect Wave 3 bullish divergence, bounce of the trendlines, a series of higher lows and than taking a top down approach, bounce of EMAs and pivot points.
So what are the guidelines for a falling wedge?
Free Educational downloads
Bindal FX provides free educational videos and articles, please feel free to download these from our website, the link is as follows;
http://www.4x4u.net/Education.asp
http://www.4x4u.net/review/51/51.html
Key aspects of a falling wedge are summarised as follows;
A Wedge formation is similar to a triangle in appearance in that they have converging trendlines. A falling wedge is generally a bullish chart pattern that begins wide at the top and contracts as the prices move lower. This pattern has a series of lower highs and lower lows.
The following chart on EURGBP (Nov2006) illustrates a good example of a falling wedge, and this was covered live at one of my live Webinar enabling traders to pull the trigger, thus far it has been a very good profitable trade.
caption: Charts by Esignal.com
The bullish bias is generally realised when there is a break of the resistance line. However, often aggressive traders are able to get in early provided there are a number of confluences of indicators, in the above chart you have a perfect Wave 3 bullish divergence, bounce of the trendlines, a series of higher lows and than taking a top down approach, bounce of EMAs and pivot points.
So what are the guidelines for a falling wedge?
- A price trend must be underway leading to a pattern.
- There must be a falling upper resistance line with 3 or more touches.
- There must be a falling lower support line with 3 or more touches.
- Contraction - the support and resistance lines converge to form a cone as the pattern matures.
- Breakout - this can be in any direction, but generally it will be to the upside.
- The pattern is confirmed when you have a decisive close outside one of the trendlines.
Free Educational downloads
Bindal FX provides free educational videos and articles, please feel free to download these from our website, the link is as follows;
http://www.4x4u.net/Education.asp
Last edited by a moderator: