Eurusd

Well I ****ed up big on Friday so unless someone is really interested in what happened I'm not going to make the effort to post Friday's trades.

Today's trade:

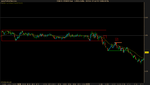
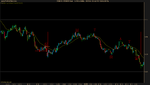
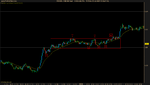
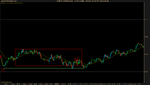
Prices finally broke out of this range hanging around the 1.26 handle after the ISM manufacturing numbers came out. You can see the typical digestion of the news with the price action for 7:00 to 7:03. The numbers came out worse than expected which intuitively means the dollar will weaken. I admit I entertained a bullish bias after the numbers came out and was confused with prices started to drop. I quickly realized my folly and changed outlook to neutral and tried to analyze price action. I was considering an ARB trade (S1) but felt that the price action inside the range did not support a bearish trade at that time. In other words, there were few clues pointing to the bears having the upper hand prior to the news release.

E1: I waited patiently for an opportunity to trade after that skipped ARB. Prices broke out of the range, tested it, then moved down even further. It looked like a new trend was forming so I kept my eyes peeled for a pullback setup. Prices pulled back to the 20EMA, printing an FB. I waited for the superior SB setup and after prices broke the first pullback high, the dropped back down again, making that break a false one. I was rather nervous when prices seemed to have trouble breaking the 83 level (green line) and I was considering lowering my stop 3 pip lower (lack of follow through on the break). I'm still skittish about the break even as prices drop below the 80 level in a slow manner. I see some stalling as prices reach within 0.5 pip of my target and I decide to close early. Again, I am rather unsure of adding 0.8 pip to my target so I am ready to close out early when the trade is over 10 pip in profit.

9.4 pip profit for me today.
 

Attachments

  • USD Spot.png
    USD Spot.png
    12.2 KB · Views: 309
  • Capture.PNG
    Capture.PNG
    6.6 KB · Views: 262
Sorry for not posting in awhile but I've been busy. I'll start with Tuesday's (7/3) charts even though I didn't take any trades.

S1: Skipped a DD setup. It just didn't look...right. There's that large bearish candle followed by some stalling and then a move down to the 60. That's followed by a pullback to the 20EMA but I just couldn’t bring myself to trade it. I was worried about the 60 level becoming support for prices. I think that is the only valid reason for skipping this trade. Everything else looks fine. We have a downward trend after some ranging, we have a pullback into the 20EMA that retraces about 40% of the last swing high and we have 3 dojis form at the end of the pullback. But we don't want to short into support.
 

Attachments

  • Untitled picture.png
    Untitled picture.png
    11.2 KB · Views: 230
Still Tuesday (7/3) chart

S2: Skipped RB here. I had three opportunities but skipped them all. I convinced myself that taking a long trade would be a bad idea. This was reinforced by the fact that the upper barrier started to look vague as the breakout faltered and stalled for awhile, so I passed on the later opportunities. Let's see what clues we can scrape I hindsight.

We have a double bottom on the 60 level (1 and 2), meaning the bulls have established a base of support. The bulls bring prices up with some resistance from the bears, forming a mini double top (3 and 4). We now have a possible range barriers. With the trend before the range being down, the overall pressure now is in favor of the bears. There's some fighting around the 20EMA but the bears manage to bring prices down. The bulls haven't given up and start buying above support (5). The bears are either taking profit or the sideline bulls are entering, but either way, prices stall in a new level of support, which the bears test later (6). Again, renewed bullish interest leads the bulls to make a tease break (7). The next two opportunities come and go (8 and 9) but I still don't feel that their were enough clues to justify a countertrend trade. I guess 6 counts as an odd event. But even then, it still seems tricky to take this counter trend trade. That double bottom just doesn't seem prominent enough to convince traders the bearish trend is really over. I would like to see more price action before a break some along the lines of example 11.6 or 11.9 in the book.
 

Attachments

  • Untitled picture.png
    Untitled picture.png
    12.3 KB · Views: 231
Still Tuesday (7/3) chart

M1: The trend was up. There was a potential for a trend equals trend phenomenon. The bottom range barrier finds support in the a bull flag pattern (1). We have a nice upper barrier (2 and 4), with a higher double bottom (3 and 5) above the 00 level. We also have a higher high (6) and some tension before the break. I think I should've taken this trade but I just did not feel like trading at the time and so wasn't very attentive. Could've taken this as a slightly aggressive RB or later as an ARB.


I didn't trade on 7/4 because is was a US holiday.
 

Attachments

  • Untitled picture.png
    Untitled picture.png
    12.3 KB · Views: 224
7/5

DD: I was quite distracted with trying to catch up on what happened earlier while eating my sandwich so I missed this DD setups. The only thing to be worried about is support at the 20 since prices did bounce off that area.


E1: This was a snap decision trade, something that I haven't done in awhile . I was trying to fit the price action into my chart but given the big downward movements I had to scale the prices down, which made the candle bars look smaller. I saw a block form in a strong down trend and jumped on it without much though. I took this trade not realizing that my stop would be ~8 pip (the setup is 5 pip tall) from entry, something that is acceptable within my risk limit but too aggressive for me to trade. It would have been preferable to wait for some pre-breakout tension. My order ends up slipping 3 pip because prices broke out fast. The break appears to have been a false break of the 80 level and I get stopped out after moving my stop to a more economical (but still based on technical grounds) level.
 
ARB: Missed an ARB here because I was pretty distracted with watching Bloomberg TV (bad!). After that false break of the 80 level from E1, the bulls pushed prices back up the 1.2400 level and faced steep resistance from the bears (1). The bears managed to print a lower high (2) and proceeded to clobber the bulls all the way back down the 80 level (3). A round won by the bears. The bulls haven't given up yet and again buy at support but are only able to print more lower highs (4 and 5). The bottom barrier of the range is a bit ambiguous so that explains the hesitation after the break. We can draw a signal line of the tiny block of bars and trade the break of it.
 

Attachments

  • USD Spot.png
    USD Spot.png
    14.2 KB · Views: 708
E2: I don't know that I was thinking when I took this trade. I was still distracted with watching Bloomberg TV. I tried to take this trade as an ARB at the time but looking back, this wasn't a valid setup. I tried to trade this as the pullback version of the ARB, where prices break a range barrier, pullback inside to the level of last resistance, form a stalling signal bar, and break downward. A couple problems with this trade: 1) The break of the bottom barrier matched an earlier low (1), which suggested support at that level; 2) prices pulls back and found the level of last resistance but stalled longer than preferred, suggesting that the break may be a tease. The biggest problem was that I was shorting into obvious support.


I end up losing 13.8 pip for the day because I was distracted and not completely focused on the chart.

No trades for me today (7/6) because I woke up too late and missed the release of the NFP numbers.
 

Attachments

  • USD Spot.png
    USD Spot.png
    12.4 KB · Views: 527
  • Capture.PNG
    Capture.PNG
    8.8 KB · Views: 488
Last edited:
ARB: Missed an ARB here because I was pretty distracted with watching Bloomberg TV (bad!). After that false break of the 80 level from E1, the bulls pushed prices back up the 1.2400 level and faced steep resistance from the bears (1). The bears managed to print a lower high (2) and proceeded to clobber the bulls all the way back down the 80 level (3). A round won by the bears. The bulls haven't given up yet and again buy at support but are only able to print more lower highs (4 and 5). The bottom barrier of the range is a bit ambiguous so that explains the hesitation after the break. We can draw a signal line of the tiny block of bars and trade the break of it.

while your trade was unfortunate, i would have taken another trade at point 2 because of the double top and also the second top was not even testing the previous high, the resistance seems strong and was poised for downwards movement. it's not the best of setup to enter but something i think is worth risking a trade.
 
Thanks to everyone who has contributed to this thread. As a complete newbie this has been an interesting read.
 
Hi Guys,

My first post and contribution here of Friday's NFP set up. I trade Bob Volman's method and have attached my chart. I'm learning the method and welcome any comments.

-Kalps
 

Attachments

  • NFP Friday.jpg
    NFP Friday.jpg
    339 KB · Views: 850
Last edited:
Hi Guys,

My first post and contribution here of Friday's NFP set up. I trade Bob Volman's method and have attached my chart. I'm learning the method and welcome any comments.

-Kalps

It looks like you go beyond the 10 pip target that Volman recommends. Do you use a limit order (do you have a maximum target)? Or do you close out winning trades based on discretion? Just curious.

For that SB trade I don't think you had to wait for the M pattern to break. You could have traded the break of the signal bar (black doji). You were right to wait for the SB instead of the trading the DD given that the lows of a couple of bars in the pullback were taken out.
 
As it was NFP day I thought that potential moves may be larger than the 10 pip bracket Bob recommends.

It paid off on Friday, however set my mind in the wrong gear for today. I was trading and I was +10 and I thought it may be worth extending the target. Ended up losing all 10 and getting out for zero. Lesson Learn to just take 10 and re enter.
 
Is this thread for a particular EURUSD strategy?

I think it was a mixture with the main most recent contributor BLS since Mike got banned.

BLS's strategy and posts are the bob volman method, which is what I have just started trading, hence I thought it'd be good to start a new clean thread just on Bob's method which BLS agreed.
 
I'm not much of a pattern trader, but this double top that just completed on EURUSD is impossible to resist.

Running it down to 1.306. Stop at 1.3115.

Ciao!
 
sorry i am new to forex, but would it advisable to short eur/dol

Advisable yes, but it's drifting relentlessly upwards at the moment - most people are relying on key resistance as high as 1.315. The crowd are heavily short the Euro, including me. It might reverse on take profits tomorrow or later today, might not... and it might even fly on NFP day. That would suck.

Good luck.

The other posters on the new Volman ramping thread , some of them are here only to post on the Volman thread .It seems something is brewing , isn't it the same old methods , freely available on forums , rehashed and revamped as pa?

Another day , another guru is born , with the same old ta rehashed.
 
Top