Eurusd

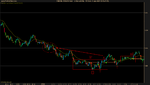
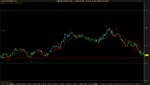
E2: The bears tried twice to crack the 00 level but failed, forming a mini double bottom. Price jump to the upper barrier of the block where there is some pre-breakout tension, with the bears trying to fight back ad the bulls try to push on. This break is something between a false break (because prices came from the bottom of the barrier) and a tease break (because there is some buildup). This setup was unfavorable because of clustering price action around the 20 level that acts as visible chart resistance. That overhead resistance is blocking my 10.8 pip target. I should not have taken this trade.

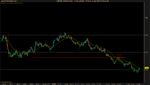
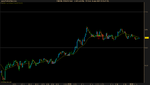
E3: Same problem with that overhead resistance as in E2. I was ignoring that clustering block for a second time because I held a bullish bias at the time. I saw the mini double bottom (1,2) and a bounce off the 00 (3), thinking that the bulls were going to reverse the downward trend. I did not give much thought to anything that might stand in the bulls' way. Scalpers should hold a neutral view and let price action do that talking instead of trying to trade in the direction of a bullish/bearish bias.

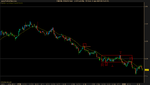
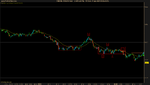
With three consecutive losses and problems with my internet connection, I decided to call it a day with a 14.7 pip loss. I did not trade well today and these bad trades could have been avoided.
 

Attachments

  • USD Spot.png
    USD Spot.png
    14.5 KB · Views: 250
  • Capture.PNG
    Capture.PNG
    11 KB · Views: 256
First trade of the day after skipping some dubious looking setups that happened to work out (hit 10.8 target). I remained patient though, patient enough to spot this Double doji setup. The trend for the 30 minutes before my entry was bearish. Prices dropped through previous support (red line) without much of a fight and pullback to this former support, which was a very good sign. Three dojis formed and I trades the break of the doji lows. I closed out my trade about 1 pip short of my 10.8 pip target because prices were stalling a bit and I did not want to risk my paper profits for 1 pip. I still have some doubts about that extra 0.8 pip on top of the standard 10 pip so I am less hesitant to close of my trade earlier short of target.
 

Attachments

  • USD Spot.png
    USD Spot.png
    13.5 KB · Views: 246
M1: Prices move too fast for me to catch this break. The bulls were buying at support (1,2,3) while the bears were trying to keep a lid on price rises. The most telling part of this block is (4), where the bears slap back the bulls and manage to break the block. The break was without buildup to prices pulled back inside to hang of the bottom barrier. A break in the downward direction is all that is needed to force the bulls the bail. Prices dropped 2 pip below my desired entry before I could even act so I decided not to enter.
 

Attachments

  • USD Spot.png
    USD Spot.png
    13.5 KB · Views: 247
I think I'm done for today with a 9 pip gain.
 

Attachments

  • Capture.PNG
    Capture.PNG
    6.3 KB · Views: 286
Last edited:
No trades for me today. The market was mostly range bound but I couldn't find any favorable Inside Range Break setups. There doesn't seem to be much interest in this thread so maybe I'll stop posting.
 
hey BLS, don't stop posting. I'm also utilising the methods described in Bob Volman's book, but without much success at the moment, being unable to identify real setup or false break. Please continue. I will post a trade in when i do make one soon.
 
hey BLS, don't stop posting. I'm also utilising the methods described in Bob Volman's book, but without much success at the moment, being unable to identify real setup or false break. Please continue. I will post a trade in when i do make one soon.

You don't have to wait for a trade to post. Feel free to post any ideas you may have or any charts you may be looking at. You can use previous days charts to try to apply the methods and analysis of Volman. I am by no means an expert oof the Volman method but the setups themselves should be fairly easy to identify - they are just a means to enter the market, not a reason to enter. The hard part is determining whether overall price action is supportive of the setup.
 
here goes..first and only trade so far..timing is GMT+8

Sharp drop and i went in on the retreat, however it bounces within a range and i almost got stopped out. Noticed it formed a triple bottom and got out with +3.5 pips. My problem is I always mistime my trades. I missed the ride at 16:35 (wasn't sure abt the setup) and entering in a less than ideal situation.
 

Attachments

  • Capture.PNG
    Capture.PNG
    53.8 KB · Views: 320
second trade and i think my last for the day, want to keep this winning streak. Had 2 days of losses prior to this.

was watching whether it would break 1.248 barrier and when it did, i entered the trade, though im experiencing quite abit of slippage here. Not sure if it's due to the connection. Went in my direction and would have made 12pips if not for slippage again. Made 10pips in the end.

It makes me wonder, do you think I should have entered the trade while it's still under 1.248 or wait till it breaks like i did? My worry is that the barrier might be too strong and the bulls might get exhausted and let go. I face this qns a lot of times when it comes to this style of trading.
 

Attachments

  • Snap 2012-06-26 at 21.43.04.png
    Snap 2012-06-26 at 21.43.04.png
    86.1 KB · Views: 333
second trade and i think my last for the day, want to keep this winning streak. Had 2 days of losses prior to this.

was watching whether it would break 1.248 barrier and when it did, i entered the trade, though im experiencing quite abit of slippage here. Not sure if it's due to the connection. Went in my direction and would have made 12pips if not for slippage again. Made 10pips in the end.

It makes me wonder, do you think I should have entered the trade while it's still under 1.248 or wait till it breaks like i did? My worry is that the barrier might be too strong and the bulls might get exhausted and let go. I face this qns a lot of times when it comes to this style of trading.

Excellent trade. I missed this one myself because I hesitated (my fear was overwhelming my calm).

No, you should not have entered under the 80 level. You were right to wait for the break. Slippage is a part of trading, though if you are getting really bad slippage, you may want to consider switching brokers.

If there is sufficient buildup in your setup, and if price action is favorable to the direction of the trade,you should not worry about a barrier being too strong.
 
Last edited:
here goes..first and only trade so far..timing is GMT+8

Sharp drop and i went in on the retreat, however it bounces within a range and i almost got stopped out. Noticed it formed a triple bottom and got out with +3.5 pips. My problem is I always mistime my trades. I missed the ride at 16:35 (wasn't sure abt the setup) and entering in a less than ideal situation.

I believe this is the corresponding chart on ProRealTime.

My personal take on this (take with grain of salt because this is in hindsight):

I would have skipped that DD trade at ~1:40 (GMT -7) because of visible chart resistance. We have to be careful when taking DD trades near round number areas. There was another opportunity at the SB but again, I would skip it because of visible chart resistance.

As for that DD trade you took, I would have skipped that as well because of that short pullback that wasn't quite one directional, not to mention that there weren't any dojis in the pullback (on ProRealTime chart anyway). One of the bars took out the low of a previous bar. But you did well to exit based on technical reasons.

If you would like more information about using ProRealTime, send me a PM.
 

Attachments

  • USD Spot.png
    USD Spot.png
    12.7 KB · Views: 301
Another missed trade at M2. The picture wasn't very clear to me at the time. I had at first dismissed M2 as unfavorable because there looked to be some former resistance under to the 80 level. After drawing the bottom barrier though, I realized that this was an Inside Range Break setup. The top barrier is formed by 3 and 5, with a false break to the upside (F1). The bottom barrier was formed (1) and (2). It seems the bears have a slight advantage. There is support from (1) and (2) but there is resistance at (3) and (5), with a false break for the bulls to boot. After failing to crack the 00 level, prices dropped and tested the 80 level. In the block, we can see three arches form (reverse cup and handle). The 20 EMA helps to push out prices to the downside. Another reason for taking this trade is that prices tend to (according to Volman) gravitate to the range barriers in a vacuum effect. I should not have worried about possible support getting in the way of this trade.
 

Attachments

  • USD Spot 2.png
    USD Spot 2.png
    13.2 KB · Views: 312
SB trade at E1. The trend was up, prices pulled back about 60% of the last swing move. There may be a vacuum effect around the 00 level. There is no visible chart resistance. The second break takes out the high of the first break but is unable to crack the 00 level. I get stopped out for a loss of 5.4 pip.
 

Attachments

  • USD Spot.png
    USD Spot.png
    12.6 KB · Views: 381
RB at E2. Since the trend was bullish, this was a counter trend trade.

The range is resting on former resistance of the bull flag (dotted box). The upper barrier was formed by (1) and (3), where we see two false breaks of the 00 level. The bottom barrier was formed by (2), (T1) and (T2). Up until (3), we don't have a clear idea of where prices are likely to go. After (3), prices drop down below the 20EMA, where sideline bulls enter and take out an earlier high that tested the 20EMA (4). Prices drop again but the bulls buy at the same level, with the bears shorting at a lower level (5). Things are looking up for the bears but they go and get served a tease break (T2). There is some resistance below the break but it is not in the way of my 10.8 pip target (very close though). I take the break when prices break the bottom barrier again but prices are unable to follow through on the break so I move my tipping point to the bottom barrier and end up exiting.

I think I am done for the day. I missed two good trades and took two losing ones for a 9 pip loss.
 

Attachments

  • USD Spot 3.png
    USD Spot 3.png
    13.5 KB · Views: 232
  • Capture.PNG
    Capture.PNG
    8.8 KB · Views: 255
SB trade at E1. The trend was up, prices pulled back about 60% of the last swing move. There may be a vacuum effect around the 00 level. There is no visible chart resistance. The second break takes out the high of the first break but is unable to crack the 00 level. I get stopped out for a loss of 5.4 pip.

Actually i would have avoided the trade based on several reasons.

1) there was a long pullback bar just as it was about to test 1.25 (2 bars before your entry), which tells me there are strong resistance around that pt

2) pullback after it sneaked past 1.25 was followed by a series of bearish bars which to me looks like there is little upside support.

3) would have avoided trading at the significant level of 1.25 which has been tested and failed several times over the day. Would have bought in only if it had cleared the 1.25 level comfortably.

In general i avoid trading around +/- significant levels like 1.24, 1.25, 1.26 as you can easily get caught up on the wrong side.
 
hmm, can't find any trade today since i was busy with stuff and any little time i had the chart was swinging up and down with no good setup. hopefully will be able to do more tomorrow. Cheers.
 
Actually i would have avoided the trade based on several reasons.

1) there was a long pullback bar just as it was about to test 1.25 (2 bars before your entry), which tells me there are strong resistance around that pt

2) pullback after it sneaked past 1.25 was followed by a series of bearish bars which to me looks like there is little upside support.

3) would have avoided trading at the significant level of 1.25 which has been tested and failed several times over the day. Would have bought in only if it had cleared the 1.25 level comfortably.

In general i avoid trading around +/- significant levels like 1.24, 1.25, 1.26 as you can easily get caught up on the wrong side.

Thanks for your input. Sometimes we are so blinded by our own biases that we miss some obvious signs.

hmm, can't find any trade today since i was busy with stuff and any little time i had the chart was swinging up and down with no good setup. hopefully will be able to do more tomorrow. Cheers.

Which sessions do you typically trade?

RB at E2. Since the trend was bullish, this was a counter trend trade.

The range is resting on former resistance of the bull flag (dotted box). The upper barrier was formed by (1) and (3), where we see two false breaks of the 00 level. The bottom barrier was formed by (2), (T1) and (T2). Up until (3), we don't have a clear idea of where prices are likely to go. After (3), prices drop down below the 20EMA, where sideline bulls enter and take out an earlier high that tested the 20EMA (4). Prices drop again but the bulls buy at the same level, with the bears shorting at a lower level (5). Things are looking up for the bears but they go and get served a tease break (T2). There is some resistance below the break but it is not in the way of my 10.8 pip target (very close though). I take the break when prices break the bottom barrier again but prices are unable to follow through on the break so I move my tipping point to the bottom barrier and end up exiting.

I think I am done for the day. I missed two good trades and took two losing ones for a 9 pip loss.

I sent an email to Bob Volman (his email address is on page 323) regarding this trade because I was unsure if this was premature or not. This trade is similar to examples 11.6 and 11.9 in the book.

His response to me:
"Your analysis seems pretty much spot on regarding the situation in the chart. The only problem with this trade is the fact that the bottom barrier seems a bit rough no matter where exactly you place it. But the pressure was down at the moment of entry, there was one more tease out of the way, so it was okay to enter short, though I would typify this one as slightly aggressive. But then again, that may be your style. Since there was very little follow-through from the sidelines and the market started to form a block against your position, it was okay to exit where you did and then look for something else to set up. All in all, good job."

My first and last trade of the day:

E1:
Taking this trade was a bit aggressive on my part. The overall pressure is bearish, with the bulls failing to retake the 80 area (1) after establishing a base of support (dotted box). Prices continued downward and bulls bought at support (2), creating a false break of the 20EMA. The bulls again buy at the same level of support (3) but the bears are shorting at slightly lower levels. There is a bit of an impasse as dojis are printed around the 20EMA, but the bears come out ahead and break the lower barrier of the box. With no resistance below, the path to my 10.8 pip target looks clear. I probably should have waited for more buildup but I thought those dojis hanging on the 20EMA showed enough tension to trade. Prices break the block, retested the bottom barrier, but are unable to follow through on the break of the 60 level. I get stopped out for -2.8 pip.
 

Attachments

  • USD Spot.png
    USD Spot.png
    12.2 KB · Views: 267
i trade GMT+8 from 9am to around 10 or 11pm sometimes.

your trade seems reasonable enough for me, though i would waited for a few dojis at support level. Noticed your SL has always been low (eg. under 5 pips)? Can I ask what is your SL levels because you may actual hit your TP if you didn't get stopped out. Well, that's just a guess since i can't find your trade on my chart. Hahah

Wow, your trading day is quite long. I usually start with the NY session and stop around the second half of the NY session because I find it to be quite...treacherous. Wish I could trade the first half of the London session as well but that would throw off my already weird sleeping schedule (for my time zone GMT-7).

Initial stop was about 5 pip in this case, then I lowered it to about 2 when prices pierced the bottom barrier before going down again. I probably need some work with the stop loss placement but I'm trying to follow the tipping point method from Volman's book. Perhaps I should reread that chapter. In this case I would not have made target even with the full 10 pip stop (support at the 60 level was too strong).

Off to sleep for me.
 
No trades for me today. Prices were more or less range bound between 1.244 and 1.242 areas.
 
Top