EURUSD technical daily analysis by GetKnowTrading

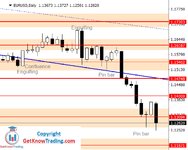
The week behind has shown bears breakout below previous day candles lows which led the price to $1.17200 support level.

$1.18000 is a round number which acted as a resistance for the price and now the market looks like it has tested the resistance before the next move down.

As a first step for the price to move down and to confirm the $1.16187 as the next target is to close below $1.17200.
EURUSD Daily Forecast 14_08_2021.png
 
The price has reversed from the weekly up trend line and closed below $1.17200 support level I was mentioning last week.

$1.17200 was a breakpoint for the sellers and now it is resistance for buyers.

Start of the week could have a small test of the $1.17200 before moving further down to $1.16187 which now is the next target.
EURUSD Daily Forecast 21_08_2021.png
 
The price nearly reached $1.17200 two days in a row by retracing back, but it could not stay there for too long.

Same day the price moved higher and closed the day higher than the previous day.

$1.18500 is a confluence of resistance where the sellers could find more strength to push the price back down.

The current market overview shows the $1.17200 as a support that needs to be broken in order to see the price moving down.
EURUSD Daily Forecast 28_08_2021.png
 
On Friday there was a slight pullback from $1.19000 which is a result of buyers exiting from the trades at the end of the week and reaching round level which is known strong resistance.

As it was mentioned in the previous weekly analysis the $1.19000 is a breakpoint for the buyers.

That means we could see price fluctuating around $1.19000 and first strong support below.
EURUSD Daily Forecast 04_09_2021.png
 
From the week beginning the price has changed direction and moved down.

The price is again in the downtrend channel which suggests further move down.

The price could break below $1.18000 and then pullback to $1.18000 to confirm break down before heading down to $1.17200.
EURUSD Daily Forecast 11_09_2021.png
 
On Monday the pair broke down from the confluence of support, but the day ended almost on the price the day started.

The price stopped on the strong support $1.17200 which is well known in the last few weeks.

From this level the price reversed back up on 20.08.2021. so we could see some price confluence here.

But, most likely the price is heading down, below $1.17200 towards $1.16180 which is now a strong confluence of support.
EURUSD Daily Forecast 18_09_2021.png
 
The market did not move too far from the price it started the week which shows indecision in the market.

What we see here on the chart is the price having a hard time to break below $1.17200 which is not nothing strange.

Similar scenario was on 19.08.2021.

When the price broke below support level and returned quickly back above $1.17200.
EURUSD Daily Forecast 25_09_2021.png
 
The whole week was bearish and only Friday was a small bullish candle.

Bears have overtaken the market and for the last three weeks they are dominating.

I am currently outside of the market until I see a better market constellation.

I am waiting for the price to reach $1.17200 for a bearish move with a price action signal or $1.14748 for bullish move.
EURUSD Daily Forecast 02_10_2021.png
 
After breaking below $1.16187 in the previous week, the price made a small pullback to $1.16187.

That pullback was in the form of a small bullish candle which did not close above.

Bullish move could happen on the $1.14748 level which is a strong support.

At that level the sellers could get out from the market and allow the price to make a pullback up.
EURUSD Daily Forecast 09_10_2021.png
 
The small support at $1.15462 was strong enough to stop the price from falling down to $1.14748 which is strong support for the price.

The market formed a bullish engulfing candle which shows bulls strength around $1.15462.

The price is now between two levels which showed strong pressure, $1.15462 with bulls and $1.16187 with bears pushing the price in the opposite direction.
EURUSD Daily Forecast 16_10_2021.png
 
The candles formed from Tuesday to Friday you can see on the chart are all bullish and close price is above this level.

That means the bulls are strong enough to hold the price above.

The currency pair is in the downtrend so being bullish completely is not an option.

For now the price will find resistance on the old resistance at $1.17200 which will now be a confluence of support combined with downtrend channel resistance.
EURUSD Daily Forecast 23_10_2021.png
 
The price has been heading towards the North, but the down trending trendline's resistance may hold some buyers back from going long here. Thus, the price may get sluggish to go towards the next resistance at 1.17200
 
In the last two weeks the price has returned back close to $1.17200 resistance and formed a strong bearish candle.

The price dropped down to $1.15462 which is current support where the price is holding.

If the price breaks above $1.16187 it will be just a first step to see the price changing to a bullish mode.

Only when the price breaks above $1.17200 then it will be the sign of the bulls.
EURUSD Daily Forecast 06_11_2021.png
 
In the last two weeks the price has returned back close to $1.17200 resistance and formed a strong bearish candle.

The price dropped down to $1.15462 which is current support where the price is holding.

If the price breaks above $1.16187 it will be just a first step to see the price changing to a bullish mode.

Only when the price breaks above $1.17200 then it will be the sign of the bulls.
View attachment 308631
Agreed on the note that solid bull move may be seen above 1.17200. The price gets caught within a descending bearish channel, thus a breakout above 1.16190 may not generate a strong bullish momentum. Thanks for sharing your trading chart.
 
After a bullish Pin bar the price returned back close to $1.16187 and from there turned back down and reached $1.14748.

The week ended below $1.14748 which tells me that the support is not strong here.

The first support is around $1.14000 which was support for the price in the past.

The price could stop for a while and make a retrace back to $1.14748 before finding more sellers to continue with the push down.
EURUSD Daily Forecast 13_11_2021.png
 
The price has reached the previous analysis goal and that is $1.13094 support level.

As said last week the $1.13000 is a strong support where the price could bounce back to $1.14000.

The price has moved outside of the downtrend channel and stopped for a while on the $1.13000 level.

If the next Monday closes below current price then $1.11871 is the next stop for the price.


Attachments

  • EURUSD Daily Forecast 20_11_2021.png
    EURUSD Daily Forecast 20_11_2021.png
    27.3 KB · Views: 84
Looking into the past analysis two weeks ago the price reached $1.11871 in the pip.

And then bounced back up to first resistance at $1.13094.

This week I am expecting to see the price close to $1.14000 level and then move down.

The $1.14000 level is a confluence level of resistance we can see on the chart.
EURUSD Daily Forecast 04_12_2021.png
 
This week’s price did not reach the previous analysis predicted level, but the market overview looks like it is preparing to move up.

On Friday we had a small bullish candle whose low price was not below a large bullish candle and that suggests the price has strong support on $1.12650 level.

As the market now looks it seems the price will move higher and reach $1.14000 which is a confluence of resistance.
EURUSD Daily Forecast 11_12_2021.png
 
The EURUSD price was ranging the whole week where we had two strong moves outside the range area.

The week started with two bearish candles where Tuesday’s candle closed below previous daily closes.


The price could find support at $1.11871 and return back up because the price is now in the indecision area.

We have strong buyers at $1.11871 and strong sellers at $1.13600.
EURUSD Daily Forecast 18_12_2021.png
 
Top