EURUSD Help?

phoenix25140

Active member
Messages
102
Likes
2
With a greece bailout and poor US numbers, why the sudden increase from the downtrend from a high?

Analysis please. My limit order on my sell trade (from 1.331) was 1.3190. Stopped out for no profit or loss :/
 

Attachments

  • eurusd15.08.jpg
    eurusd15.08.jpg
    127.5 KB · Views: 176
Are you talking about today's up move or the move that started in July?

For today, you have a white line around 1.32. Why do you have that there and what does it mean?
 
Dont really get exactly what you ve done
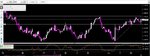
but the Euro for now is still in a Wkly uptrend
so is the GBP / Aussie / and NZD

so only best to trade with the trend (unless you re very good at trading pullbacks)

and ignore bad news - if in an uptrend - its never that bad

the Wkly uptrend for the GBP and Euro is nt that far from over though - give it a wk or two
but imo, there may only be a moderate pullback and then another wkly uptrend
possibly around the German elections or just after
 
With a greece bailout and poor US numbers, why the sudden increase from the downtrend from a high?

Analysis please. My limit order on my sell trade (from 1.331) was 1.3190. Stopped out for no profit or loss :/

Why sell? You have even marked off the 1.32 level as support yourself, as well as 1.34 as resistance. This along with the fact it is in an uptrend should tell you that this is a pullback to test that 1.32 level for further support before making a break higher above 1.34.

Just my opinion.
 
thanks guys, I now see the strenght of the 1.32 resistance. Any sell trade would need to be a break through this ?

Thanks
 
thanks guys, I now see the strenght of the 1.32 resistance. Any sell trade would need to be a break through this ?

Thanks

It depends on a variety of factors. Fundamentally if you look at the EUR USD why is it moving up? The main reason is due to the uncertainty amongst traders over what the Fed will do regarding its bond buying programme come September, as some fear they may begin to cut stimulus. It went lower in early trading as new jobless claims fell to a six year low, but then rallied after US factory data came in weak for August. The constant mixed bag of results has everyone second guessing and it just isn't clear for now.

The next thing I would do is look at the charts and what they are telling you. You have a daily chart up I presume? You can clearly see now the two big levels price is in a range between. It will likely need some news to drive it through one of those key levels. At the moment the price action indicates it will likely retest $1.34 and so I wouldn't be short.

If you really want to get involved, look at some intraday charts and trade the range. Go short from $1.3390 with a S/L above $1.34 and go long from $1.3210 or something with a S/L below $1.32. It may require some patience but can be worth it whilst you wait for the big move.

Last piece of advice, when trading a range like this you should be very careful when going against the trend. In this case that would be selling.
 
Top