You are using an out of date browser. It may not display this or other websites correctly.
You should upgrade or use an alternative browser.
You should upgrade or use an alternative browser.
jimvt
Active member
- Messages
- 164
- Likes
- 1
Got it sorted in the end, thanks T.
If anyone wants to see the esignal forum thread it is here:
http://forum.esignalcentral.com/showthread.php?s=&postid=48186#post48186
I learnt that for continuous futures you should set the Global server expiry pattern to 81, amongst other things.
Cheers
If anyone wants to see the esignal forum thread it is here:
http://forum.esignalcentral.com/showthread.php?s=&postid=48186#post48186
I learnt that for continuous futures you should set the Global server expiry pattern to 81, amongst other things.
Cheers
TWI
Senior member
- Messages
- 2,562
- Likes
- 269
Yes, the #F are a problem to set up. One thing to remember is that if a product starts trading at e.g. 8:10am put 8am in time otherwise all your hourly bars will start at 10 past hour. Unless you like that, better to put always round hour to start.
#F are also not back adjusted and there are no #F for EU futures...Hope they do this soon.
#F are also not back adjusted and there are no #F for EU futures...Hope they do this soon.
jimvt said:I am giving some thought to subscribing to Esignal but have a few queries. Can anyone help?
1)Data: I understand you can download data for backtesting. If so, how much intraday data can be downloaded, at what compression (tick or minute), in what format(ascii ?), and how clean/good is the data in your opinion?
2) Is it straightforward to hook up TS 2000i in realtime?
3) How does esignal respond at times of sudden increased market volatility? (Mytrack , my current service, are often hopeless at these times - the charts just freeze sometimes).
Thanks for any help!
We operate2 chat rooms dedicated to trading the E-minis, almost 80% of our members use Esignal. We have written tonls tools and studies that we use every day with Essignal and are very satisfied.
Drop by iur PaltTalk room, it is open and free, we can ask question about Esignal or anything else trading related for that matter.
Or have a look at our site, for an idea of the tools we have built.
Greg
www.thetradingzone.com
esignal
undefined 🙄
Personally, I have had a lot of problems with esignal......i kept writing to them to correct a particular hitch in the system....they took 3 weeks to rectify...now another issue...still waiting!
😢
jimvt said:I've taken the plunge and got Esignal!
Ok, so far I have an advanced chart up on the screen and I've paid for the exchange, but it's not live. The data stopped last night. How do I get live prices, anyone?
Cheers
undefined 🙄
Personally, I have had a lot of problems with esignal......i kept writing to them to correct a particular hitch in the system....they took 3 weeks to rectify...now another issue...still waiting!
😢
purplekiwi
Member
- Messages
- 82
- Likes
- 0
Anyone else having problems with e-signal this afternoon? I can't even connect to their web site.
Maybe it is just me, but would be good to know!
Maybe it is just me, but would be good to know!
zigglewigler
Well-known member
- Messages
- 346
- Likes
- 50
Yes, somethings wrong, $ADD jumped 1500 in a minute, still no connection, good excuse to take the rest of the day off!
JayF_eSignal
Member
- Messages
- 54
- Likes
- 0
We are experiencing a network wide outage believed to be caused by a Denial of Service attack. We are working on resolving the issue as quickly as possible.
JayF_eSignal said:We are experiencing a network wide outage believed to be caused by a Denial of Service attack. We are working on resolving the issue as quickly as possible.
Hi Jayf
I suspect esignal might shortly be suffering a "Denial of subs payment attack" if this problem isn't sorted soon............
zigglewigler
Well-known member
- Messages
- 346
- Likes
- 50
Esignal accounts-A refund for the day should be given without having to request it every time this sort of thing happens.
Still y'day eve sun was very pleasant.
Still y'day eve sun was very pleasant.
roguetrader
Senior member
- Messages
- 2,062
- Likes
- 49
Hello eSignal, I was just wondering if there were any plans to rectify this abhoration, since it's now been about 2 years since I first brought it up on the forum. Whilst I realise it is a minor issue and there are ways around it I would have thought it couldn't be that hard to fix, just to remove the irritation factor.
Attachments
eSignal Support
Junior member
- Messages
- 41
- Likes
- 0
Roguetrader,
You must be using a chart type that needs high/low to properly display. Since there's only one value per day for $TVOL (closing volume that day), you'll get a better "display" by switching to a line chart.
Hope that helps.
Thanks.
You must be using a chart type that needs high/low to properly display. Since there's only one value per day for $TVOL (closing volume that day), you'll get a better "display" by switching to a line chart.
Hope that helps.
Thanks.
roguetrader
Senior member
- Messages
- 2,062
- Likes
- 49
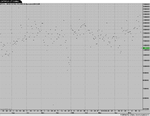
Thanx for your reply, however that makes little sense to me, I am using a standard advanced chart OHLC, whilst I realise that highs and lows are somewhat irrelevant, it seems rather simple to me that there is an open and a close, the opening value will be somewhere near zero and the close will be wherever the close is. If the software was incapable of recognising an opening value then an intraday chart such as a one hour would also be nothing more than a series of dots.eSignal Support said:Roguetrader,
You must be using a chart type that needs high/low to properly display. Since there's only one value per day for $TVOL (closing volume that day), you'll get a better "display" by switching to a line chart.
Hope that helps.
Thanks.
eSignal Support
Junior member
- Messages
- 41
- Likes
- 0
roguetrader said:Thanx for your reply, however that makes little sense to me, I am using a standard advanced chart OHLC, whilst I realise that highs and lows are somewhat irrelevant, it seems rather simple to me that there is an open and a close, the opening value will be somewhere near zero and the close will be wherever the close is. If the software was incapable of recognising an opening value then an intraday chart such as a one hour would also be nothing more than a series of dots.
So you'd like to see a bar chart that has every bar starting at zero and closing at the value for that day? Basically, it would look like a histogram? Don't recall that we've had that request so I may still not be understanding your suggestion here. Please PM your username so we can contact you directly to clarify.
Thanks.
roguetrader
Senior member
- Messages
- 2,062
- Likes
- 49
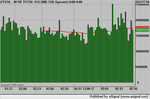
Ok, you pretty much have it, as I said there are ways around it, so fortunately I can demonstrate what a daily chart should look like (a picture paints a thousand words) What do I use this for? Well I like to see at a glance how the volume is in relation to the 60 day avge, and be reminded at a glance how previous days compare. If there's a workaround why fix it? Maybe I'm just a fussy customer paying for a premium product, who doesn't think he should have to find workarounds. Or maybe I just thought it would be a simple thing to fix.eSignal Support said:So you'd like to see a bar chart that has every bar starting at zero and closing at the value for that day? Basically, it would look like a histogram? Don't recall that we've had that request so I may still not be understanding your suggestion here. Please PM your username so we can contact you directly to clarify.
Thanks.
That statement is clearly inaccurate, if there were only one value per day then the application would be incapable of producing any sort of intraday chart for this symbol. (Maybe I am not understanding you)Since there's only one value per day for $TVOL (closing volume that day)
Thanx
Attachments
Last edited:
eSignal Support
Junior member
- Messages
- 41
- Likes
- 0
roguetrader said:Ok, you pretty much have it, as I said there are ways around it, so fortunately I can demonstrate what a daily chart should look like (a picture paints a thousand words) What do I use this for? Well I like to see at a glance how the volume is in relation to the 60 day avge, and be reminded at a glance how previous days compare. If there's a workaround why fix it? Maybe I'm just a fussy customer paying for a premium product, who doesn't think he should have to find workarounds. Or maybe I just thought it would be a simple thing to fix.
That statement is clearly inaccurate, if there were only one value per day then the application would be incapable of producing any sort of intraday chart for this symbol. (Maybe I am not understanding you)
Thanx
I say one value from a daily bar perspective. The open and low are either 0 or the first update and the high/close are both the same so from a daily bar perspective, not really much info to display. I do see how you can build a histogram as you prefer so that's great. You could also do this fairly easily in EFS and apply that EFS to a daily chart. If that EFS would be helpful, I'll poke around to see if anyone has already done one for this type of issue.
Thanks.
samuelhogg
Well-known member
- Messages
- 259
- Likes
- 5
Just subscribed to eSignal today to try it out. I subscribed to the US and UK data including the Plus markets.
While doing a symbol search on the Plus markets I noticed that there are only 6 stocks listed. Do I need to add the rest somehow or is this all that eSignal cover?
http://www.plusmarketsgroup.com/list.shtml?Group=Quoted
While doing a symbol search on the Plus markets I noticed that there are only 6 stocks listed. Do I need to add the rest somehow or is this all that eSignal cover?
http://www.plusmarketsgroup.com/list.shtml?Group=Quoted
Attachments
Similar threads
- Replies
- 0
- Views
- 3K