You are using an out of date browser. It may not display this or other websites correctly.
You should upgrade or use an alternative browser.
You should upgrade or use an alternative browser.
Scripophilist
Active member
- Messages
- 221
- Likes
- 7
Missed the action on the DOW on Friday post 21:00, that happened there? I don't have a feed to tell me what happen but it seem to move a lot after the 21:00 close?
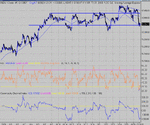
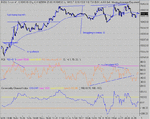
Long exit on the ND ( assuming you went long) as 64 fails to break. Took a long time to decide whether it was going to break to the upside through 64 , or drop ....In the meantime , no rush to take a position... The first try at 64 came at 17:23 and the second weaker one at 18:14, not even making 60... breaking onto a nice short entry as the uptrend support went. There was an earlier opportunity to go short at 17:33, but only 10 points away from 64 made it a bit risky...
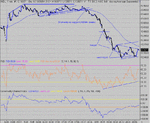
Extra tricky trying to find a good out, the first PD being quite a way off the bottom at 360, but still worth taking without a fuss. It could easily have turned round from here. It's only with hindsight that you know better... Easy 90 odd points.... The gamblers may have made a few more , this time. :cheesy:
Extra tricky trying to find a good out, the first PD being quite a way off the bottom at 360, but still worth taking without a fuss. It could easily have turned round from here. It's only with hindsight that you know better... Easy 90 odd points.... The gamblers may have made a few more , this time. :cheesy:
Attachments
alanbeale2001
Junior member
- Messages
- 30
- Likes
- 1
was i just lucky?
I made a post yesterday to which jpwone and others responded regarding my first trading day (today) with live prices and twin screens using sma10, ema30 and ema60. ( Many thanks to JPWone).
Got home at 4.50pm(uk) seen a divergence developing between at about 6.30pm and dived in!
Took 79 points and closed.
Was another 10-15 points there and managed to take 6 more clear points with a half stake entry.
The divergence on the 10 sma freaked me a little at 19.52pm later crossing the 30 ema suggesting a stop. The trend appeared to be reversing.
So a good day, a clever analysis or just plain lucky? I'm tempted to say i dont care but would welcome some feed back.
Many thanks to all especially JPWone.
Alan
CM,
In my limited experience of watching & trading the DOW, using your methods, I have noticed on a number of occasions when a strong move is underway that the end of the move coincides with a 4 peak RSI div, rather than the usual 3pk.
I was wondering whether you had ever considered this in the past, or whether it's something that's happened just a few times recently.
( Last night's move prompted me to write this as it nicely illustrates a 4 pk out )
Thanks,
hampy
tradesmart
Experienced member
- Messages
- 1,286
- Likes
- 22
Hampy and others. The 3 pk divs have worked well over the last year or so. Nothing is forever, and one must adapt to changes. Maybe it's time to consider the 4 pk divs? Obviously all the big boys have read this thread and they are trying to upset the apple cart by going that extra div!
Worth noting to see if it's going to be a regular prominent feature of the Dow.
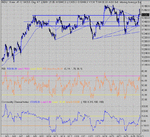
Just a quicky tonight. :cheesy: Pullback and test at hor resistance, now support again. Is that a 200 point triangle I see? ....
Worth noting to see if it's going to be a regular prominent feature of the Dow.
Just a quicky tonight. :cheesy: Pullback and test at hor resistance, now support again. Is that a 200 point triangle I see? ....
Attachments
tradesmart
Experienced member
- Messages
- 1,286
- Likes
- 22
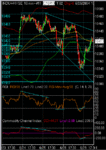
Holding within the boundaries of CM’s 200 point triangle for now, but the lower line at 350ish looks inviting (maybe)……..
With the FED rates statement coming up at 19.15 bst, rumour has it that dealers in NY have their fingers hovering over the ‘whipsaw’ button……!?!............ 😡
*Guess who*..........?!? pic - A big day for the US economy and Big Al operates the whipsaw button personally..........
With the FED rates statement coming up at 19.15 bst, rumour has it that dealers in NY have their fingers hovering over the ‘whipsaw’ button……!?!............ 😡
Ken Tower, chief market strategist at CyberTrader, said the usual mulling over the Fed's accompanying policy statement would probably render the rest of the session indecisive. But he predicted that Thursday and Friday stocks could see gains as investors would "be back to thinking more rationally".
"He is the kind of person who knows how many thousands of flat-headed bolts were used in a Chevrolet and what it would do to the national economy if you took out three of them."
*Guess who*..........?!? pic - A big day for the US economy and Big Al operates the whipsaw button personally..........
Attachments
Last edited:
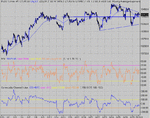
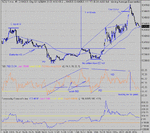
We've got some good guidelines now with the horizontal channel well defined to assist in decisions. Another break on the Fed news and a pullback into the close to end on support. The best the triangle can do is around 550, but the horizontal resistance/support at 432 ish is strong and may become yet again an irresistible magnet.
Attachments
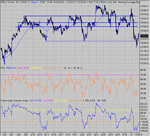
Great day, great start, straight out of the blocks with a short of the failed 432 and into the battle for 400. No panic here as the price sat under the 100MA and dropped through the hole at 400. Easy cover on the bottom with divergence and confirmation on ES vol on 3 lower lower with the accompanying lower lows on vol, albeit over a short 22 minutes... So into a long? Not yet.... too risky as 400 needed to be tested and break or a drop down through 64. However, on the way to 400 , the pullbacks showed real weakness in RSI. The d top at 400 might have encouraged you to go short... If you did there was an easy out as the price levelled at 382 in readiness for the fed rate news. From 18:45 to 19:05 a quick check on ES vol showed absolutely no sellers- a clue to the direction I think.Prior to that 18:36), lots of volume with no real drop in price suggesting ppl buying into the possible move.... Any way,that, the RSI divergence and weak RSI on the drops persuaded me to take a long with good results. I took T1 as the exit target, but waited a tad longer for the 3rd peak in RSI.... That T1 came exactly at 1 hr 10 mins from the middle peak giving almost perfect symmetry for the 3 pk nd top. A quick look at ES vol showed the sellers coming in and an out for 466. An easy 100+ :cheesy:
Attachments
dc2000
Veteren member
- Messages
- 4,766
- Likes
- 129
Absolutely amazing day, a little disappointed we didn't get to 10262, maybe tomorrow we will bounce between 262 and 344 ( not an invitation to trade) not for me, taking the day off (from trading anyway) A nice long weekend for all those that trade the US.
Similar threads
- Replies
- 0
- Views
- 2K
- Replies
- 10
- Views
- 6K
- Replies
- 902
- Views
- 125K

