Dow Intraday Charts 19 Jul - 23 Jul

Just one trade today - long ay 10001 at 12:20 on first pullback to 100ma after reversal from bottom. Looked like it was going to be stopped out but turned back up just in time. I exited at 10060 for +59 at about 15:20 on a kind of stretched out ND going back to 14:15.
 
Hi guys,

Looks like a long with next resistance at 10025? Any views?

Thanks
Hammer :cheesy:
 
Yep, and how about a fill of the opening gap at 10048 ish
Also gap on the Naz was bigger so Dow may continue to rise if the Naz tries to fill it's gap.
As I type 100 ma on the dow broken and 1st pullback taking place. If the 100ma holds we should be on the way up
hampy
 
Yep seems like 100ma is holding so it looks like a long. Also looking like a small bullish triangle forming

hammer :cheesy:
 
Now in the lunchtime chop either side of the 100ma. This may set up for a 1900 move or, as it's a Summer Friday, following a good trding week this may be a good time to abandon to the pub or barbeque and take advantage of the weather. I shall settle for the latter :cheesy:
Have a good weekend!
Cheers,hampy
 
Back to the lower channel....
 

Attachments

  • dow 23-07-04 10.gif
    dow 23-07-04 10.gif
    35.7 KB · Views: 221
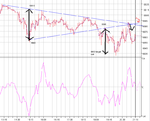
Different tack tonight after what looks like a hard day.... Suppose you took a long at 1010 at 15:55.... you're in the clag pretty quick aren't you?..... You thought 10k was the flying break...It came off 64 , tested 10 K twice then broke up through. How safe is that? well, safe you thought, but it's gone pear shaped and we don't want to panic an exit, It might just reverse and fly back up. So what to do..... Look back for clues.... the price looked like an ND top but RSI was following the price, so we can assume it's not a top so we're not in imminent danger.... OK so we didn't see the bear flag, but we see it now.... and it's target is around 9950... The 100 MA is flat and starting to drift down... so we think about the 100MA rules... We start to bottom out at 85 and RSI is well off the lows at 40 100MA is dipping slowly and this trough is not going to make the 950 target...and we're 16 below the 100MA. The price slowly rises up and this time we see the bear flag , being more alert having missed the first one...WE can see that the drop from this bear flag is going to be around 30 points , but we dont quite know exactly from what point.... but we can take a guess and say it's going to be from around 10K so that'll be 9970.At this point things are looking to get worse for our long.!00MA is still moving down slowly. WE know that there is a prior target of 9950 and if we don't break to the upside, it's likely to be met sooner or later.... and it could be a direct drop through our guesstimate of T1 at 70 . The only sensible option is to take the hit around 10K at 17:00.
This is taking a closer look at two things- taking a really bad trade at the outset, and trying to manage an exit instead of either hoping it will come good, or panicking. It also illustrates how the 100MA in a slow drift will sooner or later take you into deep water if you got your entry on the wrong side.
What if you had gone short at 1010? Much easier story... you know the price has to re test 10K and if it breaks, it's likely to pullback before taking of, giving an exit opportunity. So, you are sitting under the 100MA and even the retest of 10K at 18:30 is not too much bother.... RSI is peaking out with a mini ND and off it goes dropping through the bear triangle and T1 (at last) to bounce off 32 with PD and an exit...
OK so you're saying 'you must be mad to take a long at 1010'.... but S*** happens to us all at sometime. :cheesy:
 

Attachments

  • dow 23-07-04 1.gif
    dow 23-07-04 1.gif
    27.1 KB · Views: 244
Thanks for the insight CM. Yes, I didn't see the 1st bear flag, thinking of a long to fill the various opening gaps. Fortunately the 100ma and proximity of 10k had me looking for a more positive break and so I never took the long at 10010.
Didn't take the short either and opted for the early finish instead.
As always your time and effort is much appreciated.
Cheers, hampy
 
Great commentry CM. Think i was in similar position of managing an exit from a long at 10k. Been a rough couple of days for me. Think my trading mentality went out the window when i started having a string of losing trades. Good thing i got the wkd to lick my wounds!

By the way the losses got me thinkin, does anyone know where i can get historical data of intraday charts, wanna look at diff time frames of intraday charts and practise spotting some trading signals. D4F is really bad for charting IMO! I am using some of the past weekly dow threads but CM has already got the answers there! :rolleyes: Wanna use them to compare my analysis to anyway. Actually come to think of it a really good thread would be if each day we had 1 post from each person accompanied by a chart giving that persons round up of the trading day on the dow. (could use it for forex and other indices aswell). I reckon ppl would learn alot from seeing the same data interpreted in different ways. Sry going a bit off the subject but if anyone can help me with the data pm pls.

Thanks
hammer :cheesy:
 
I just tried downloading 1 yr of intraday 1 min data and it says "gold membership only"....... I saw a post a long time ago saying where you could get 30 yrs worth on CD for a few dollars....
 
Hi CM,
I dont know about downloading data on block , but if you go to chartstream you can access upto 20 days of intraday charts and using java charts etc I thinkyou can go further back. at the most I think you only have to register free of charge. you can detach a chart in chartstream and get a bigger workspace.

hope this helps.

Cheers

Triplepack


I have becomea 64 - 32 addict nice one!
 
ChartMan said:
.......I saw a post a long time ago saying where you could get 30 yrs worth on CD for a few dollars....

That would be useful to me, if you can remember where you :eek: it
 
Hi CM. I am still not sure of the 100MA rule regarding breakthroughs, if there is no divergence and the price breaks through the 100ma and pulls back , is the direction of the 100ma important? should the price and 100ma be going in the same direction?
 
Eddy- I've never given the direction / slope of the 100MA at breakout/down any thoughts up til now.... maybe I/we should . My comments earlier pointing out the slope was really to investigate an exit strategy when you get it wrong. It just so happened that the 100MA was drifting down and I had noted in the past that whilst the 100MA rules were basically sound, one could come well unstuck if you were on the wrong side and the 100MA slowly drifted away, taking the price and your trade into much deeper water.....
 
triplepack said:
Hi again CM ,

I think I've found the site whci you were referring to for data on cd's,

http://disktrading.is99.com/disktrading/

intra day start date 11/96.

triplepack.


Thx for the link Triplepack but the site must be down or something will give prophet.net a go but still after long term data. If you come across anything else let me know.

Thanks
hammer :cheesy:

Ps. What are the predictions for next week? Friday saw IMO a triangle which was almost txt book (from what i have been reading!). The breakout, target fulfilled and the return bouce off the trend line. i would say we have more downside to come however if it breaks through line A then it could act as support for the uptrend. Time will tell......
 

Attachments

  • dow.PNG
    dow.PNG
    40.8 KB · Views: 217
Last edited:
Hi CM. Ok I take it from your reply that it is worth considering. I would add a rider, that when the 100ma is flat and there is divergence that any breakthrough has 2 out of 3 confirmations so that with a tight stop the trade is viable.
 
Hi Hammer,

just checked it now 1230 straight through - ok. now.

triplepack
 
Top