Do we need indicators?

I guess my opinion on this matter is well known...

I just don't see any basis, any underlying theory of why an indicator, mathematically derived from a price series should have any predictive value.

Now of course, you could say "trading isn't predictive" - but you are making a bet on a future outcome and for an indicator to help you make that decision, it needs to help in the analysis process.

It's easy to get caught up in confirmation bias when looking at historical charts. Have any of the "pro indicator" guys ever compared the performance of their indicators against completely random lines?

My expectation is that random lines would work just as well as indicators.

TRO thinks so, too
 
I think i would agree with you on most of your comments above ......... - except with regards to your interpretation ( and others) that oscillators are leading indicators. I think for a high proportion of time and in normal market conditions - oscillators are lagging - and in some cases - extremely misleading.
FoMo,
I'm not 'interpreting' anything or offering a personal view. I'm presenting the standard view of the technical analysis (TA) establishment. Lots of people take issue with it - as evidenced by this thread. The point is that it's important that we all start from the same place and recognize that terms like 'leading' and 'lagging' have well defined and well established meanings within the wider TA community. That you (and others) disagree with those definitions and whether or not indicators of any kind are or aren't 'leading' - is absolutely fine. Just don't use the established language with established definitions and then attribute an entirely different meaning to them. That's my only point. I suggest you revert to using 'proper' and tell us precisely what you mean by it.

For the record, anyone who may be wondering who or what my reference source is for the established meaning of 'leading' and 'lagging' indicators, it's none other than Steven B. Achelis, the designer of MetaStock and author of this definitive book on TA indicators: Technical Analysis from A to Z
Tim.
 
Last edited:
No one has mentioned proper leading indicators - and I don't mean Elliots Wave or Fibs - I mean divergence on oscillators and even a basic trendline on a 1 or 5 min chart.

I don't see how they can be any more leading than any other indicator. All indicators work with past price action and we traders take a view on the probability of their sustainability. Even support and resistance which are about as good as it gets aren't written in stone and only have a probability of being useful.
 
My expectation is that random lines would work just as well as indicators.
This is an extremely interesting comment. I've played around with using targets for both entry and exit and while my success with them is probably 50/50, the confidence bestowed upon me in expectations of target levels being hit does enable me to trade more confidently. I'll not be in any hurry to move my stop to breakeven or to exit my position on the first sign of counter movement. I'll sit tight and let it play out.

No amount of confidence will compensate for a poor method or system, but it does seem to allow me to let my normal system do what it's supposed to do rather than having me twitching in time to every tick and fussing over it and generally just getting in the way.

With my targets being about as good as they are not, your suggestion of using random lines, obviously sensibly placed with regard to timeframe and current volatility, might well convey that same level of certainty necessary to allow our methods to do their job without profit-limiting interference.
 
Last edited:
173988d1398329440-intraday-live-short-term-trading-calls-expert-retail-forex-trader-ej-24414.jpg


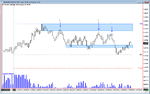
Well heres an example of a live trade on the EJ taken in the last hour

I scalp sold the pair at 141- 79 - ie the interim high ( I actually got 141 786 as entry)

My stop would be 3 pips and I am using indicators to get the accuracy I need

Already - the trade in under 30 mins as a net RR of 4+

My leading indicators are -

1. Time frame changes in a half hr time window ( 9 mins either side)

2 LR indicators on a 1 min chart set at different setiings to show Price structure

3. Trendlines - 2 shown - and for me - are leading indicators

4 - Resistance - interim resistance band at 75 to say 85 with past R at 80

Along with a few other indicators - this gets me my scalp accuracy

To try and do this with a naked chart - is possible - with a bit of luck - but certainly far more difficult etc

I have not shown ray lines and angles of rise and fall etc - as did not want to confuse further etc - nor small frame oscillators such as a RSI on a super quick 2 setting

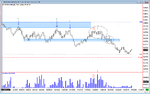
I will also find some past charts with my best leading indicator - ie the LR2

This indicator - works in advance of price movement and is therefore truely leading

Like anything techinical in forex trading - it can never be 100% accurate - trading is not a mathematical science and is not clean black or white - its full of grey and uncertainty

These reasons are just my own case for why I need indicators

I would also like to point out - all broker platforms are not that accurate

I would compare them with say a 1950's Ford Speedometer - ie showing 70 mph and doing a true 62 mph.

To get the most out of indicators - you have to mainly ignore the normal standard settings and bespoke them to your requirements - as well as play with them - as I have with Linear regression indicators on tick and 1 min charts to get rid of as much lag as possible - but still show structure in the present and in the near future

Please dont think I have anything against naked chartist - or 4 hr or daily chart traders. The latest "fashion" - I am seeing on some on other sites is traders uisng weekly charts for their entries;-)

Nothing against that - I use weekly / monthly and even quarterly charts to get the big picture view - and I am a scalper - but try to predict that far ahead to me is really pure guessing and so for me - high probability is vastly reduced.

I take on board Tim's points with regards to my terminology etc - and all comments i make are purely based on my own findings over last 11+ years - and are not necessary the views of other experienced traders

The question is though - are they making the retail profits I say are available - and if not - why not ??

Regards


F
 
Last edited:
FoMo,
I'm not 'interpreting' anything or offering a personal view. I'm presenting the standard view of the technical analysis (TA) establishment. Lots of people take issue with it - as evidenced by this thread. The point is that it's important that we all start from the same place and recognize that terms like 'leading' and 'lagging' have well defined and well established meanings within the wider TA community. That you (and others) disagree with those definitions and whether or not indicators of any kind are or aren't 'leading' - is absolutely fine. Just don't use the established language with established definitions and then attribute an entirely different meaning to them. That's my only point. I suggest you revert to using 'proper' and tell us precisely what you mean by it.

For the record, anyone who may be wondering who or what my reference source is for the established meaning of 'leading' and 'lagging' indicators, it's none other than Steven B. Achelis, the designer of MetaStock and author of this definitive book on TA indicators: Technical Analysis from A to Z
Tim.


Hi Tim

Ok - back to my definition of a "proper" technical indicator

For me - i start off with the view that all charts and all indicators are showing what as happened in the past - ie whether it over a month or just over an hour - its in the past.

To take a trade - i need a future view - whether it may be for just 5 mins or 30 mins or even 3 days - I need assistance to make my decision - and price alone - just cannot give what i need.

A "proper" indicator will - I hope - warn my of change - ie price as risen say 100 pips in last 6 hrs - why should it change ??

The fact that we trade from all around the world ie say 200 countries - we all have different chart views and a traders 4 hr chart in say Australia - might show a different set up to a trader in France - due to the time zones and changes in time frames. The only charts that show all traders the same view - are charts all under the 1 hr time frame.

That alone - for me is a "proper" indicator- one hr time frames .

For sure not everything will change from 1 min to the hr compared to 1 min past the hr change - but traders entries and exits seem to happen in time windows - and I personally use 9 mins either side to take or exit my trades - assisted by price action along with S & R - Trendlines - LR's - oscillators - but all off a tick or 1 min chart - as those charts are the nearest to real time - and therefore have the minimum lag

Harmonic wave patterns - EW theory - Murrey Maths - Gann - Andrews Pitchforks - Bollinger Bands -supply and demand theories all have elements of being leading indicators - as they are providing a guide to were price should go - but for me in isolation - I dont count them in my definition of being "proper" indicators - as their success rates are what - 50 /50

One "proper " indicator in isolation - or on its own is not sufficient for 70%+ win ratios on hundred or thousands of trades.

However combining a group of proper indicators - and i will not repeat mine - can get you well above that crucial 50 % win ratio. OK i know you can with good MM be profitable on a 30 or 40% win ratio - but I don't want to insult traders intelligence by saying that we would all prefer 90% to just 35% - as long as the RR ratios stack up and are positive etc

Have not mentioned another proper indicator i use - ie gameplay or stop hunting. You will not get this indicator on a MT4 platform and maybe the majority of traders will not have a clue I am on about - but many times - price is deliberately made FALSE.

Its set up to encourage bulls or bears to enter new trades - before the market changes direction

You do get to spot this only when you have years of experience behind you - but it happens - and i just wonder how the naked chart brigade deal with it - other than using larger stop sizes - which after all are counter productive

OK - enough for now - back to trading - although already done my target for the day ;)


Regards


F
 
Have not mentioned another proper indicator i use - ie gameplay or stop hunting. You will not get this indicator on a MT4 platform and maybe the majority of traders will not have a clue I am on about - but many times - price is deliberately made FALSE.

Its set up to encourage bulls or bears to enter new trades - before the market changes direction
You don't actually mean FALSE do you? If you're talking about forex the price is the price across all platforms with infrequent and minor fluctuations arbed out. There are times when the price appears to be pushed just prior to bigger counter moves, but I wonder if that isn't just one crowd betting the wrong way ahead of the way the real crowd is going to go? It's a big, solid market and I just don't see any way in prime trading session how any one or collective could have that much muscle.

In any discussion of future direction there will be two camps. One will always be wrong for any given timeframe. There are as any instances of price taking off and keeping on going as there are what could be considered dummy moves, I believe it is all just basic market dynamics and not deliberately managed gameplay or stop hunting, why would anyone bother to try and hit stops - they're all over the chart.

That's not to say the institutions don't try and facilitate each others customer order flow as you can see that quite clearly sometimes around the major centres opening times, but even that is not a bankable phenomenon. Best to assume it's all quite random, mostly.
 
Last edited:
Have not mentioned another proper indicator i use - ie gameplay or stop hunting. You will not get this indicator on a MT4 platform and maybe the majority of traders will not have a clue I am on about - but many times - price is deliberately made FALSE.

Its set up to encourage bulls or bears to enter new trades - before the market changes direction

Price is price, that is the market. It's neither true or false, that's its value. Nothing more nothing less.

What is key and what so many fail to understand, is that those that understand price, know how it moves and who is stuck and where there stops are likely to be. The majority of traders all think the same, see the same patterns (for want of a better term) and are all likely to have the stops in the same places.

As has previously been mentioned, no one organisation has the financial capability to move a liquid market sufficiently (in FX that is), so why do "stops get taken out"? Because those that understand and can read price also understand what the inexperienced or misinformed are 'likely' to do. Also, don't forget, those trading large positions also get stuck. If they're long and the market isn't moving, they will get out quickly, fuelling the downmove even more.
 
Ok, I had a feeling it would end up with charts.

Not my favourite instrument but here's the Pound futures from this morning.

3 opportunities:

A.

Market has rallied from the overnight support and made a new intraday high. Fails to follow through. A look back at that area shows that market broke down yesterday at that point. Will it have another try to break through? No one knows. Price retraces to 84. Here's the key, price rallied, very fast to A and was rejected. The move was too quick to get in, even with the DOM open. That's not the point though. Market retraces once more to the area where it held overnight, and then some chop sideways. Then we have an attempt to break that support and very quickly it held, price rejected the move lower. Rally up to point B.


B.

Now I'm ready, we're approaching the previous rejection area and the time price is hanging around that area is increasing. Price has broken through the resistance line a little bit too much, but we still have weakness and two rejections from the area price brokedown yesterday. Sell short, filled at 89, reduced contract size, stop at the high of the bar, 4 ticks. 2 contracts off at 2 ticks to cover commissions, remaining 2 off at 83 when price starts to hold above support.

Review: not the best trade in the world, but a winner nevertheless. +2 +6 $100 - comms

C. This is where things get interesting. Price respected support and tried to get to the highs of B. It fails, miserably. A wide outside downbar and I'm short at 85. Full size, 8 contracts. Stop at 91, 6 ticks. Immediately price moves down, take 2 contracts off at 2 ticks, stop moved down to -2. Price continues to move lower, lower lows, lower highs. Stop to b/e. Approaching support, no rejection. 2 contracts off at 76 +9, stop set to 81. Price moves sharply to form the intraday low of 69, another 2 off at 70 + 15. Stop moved to 78 in the middle of the support band. Price moves away from 71 with firm closes. Final 2 take off at 74 + 11.

Review: Did I enter when the conditions said so? Yes. Did I manage my risk immediately? Yes. Did I take money off the table where possible? Yes.

+2 +9 + 15 +11 = $462 - comms.


Now, this thread is about whether we need indicators, and as I've said I'm not knocking anyone that uses them. I've posted the chart and my thought processes to (hopefully) show that it's possible to do this without indicators. As you'll see from the chart all I'm looking at is price and time, I watch volume on the DOM, that in itself is very enlightening. There is a lot that I see on the chart which is ingrained in my mind, trendlines, waves, s/r, you know the stuff that you always knew you should look at but usually don't. I've spent hours on those subjects that I now see them without the need to draw them.

I hope this has added positively to the discussion.
 

Attachments

  • BP.png
    BP.png
    35.2 KB · Views: 192
Question I have always loved to have known the answer.
Do central bank/reserve bank trading rooms use indicators?
More out of curiosity than anything else.
 
A quick follow up to the Pound chart.

Price rallied off what was the low of the day, but look at the length of the rally, it's not consistent with the rest of the market. Once again price approaches the previous area of reaction and goes sideways. The sideways action is telling us the clues, look at the bars I've put red arrows against and the time they've taken at that price point. They've spent a lot of time at that area and not progressed.

So what do you do at that point? Is the market going to push through or fail? Look at the evidence. It's failed in that area not only today but also yesterday. What's got to happen to rally through? It's going to need some serious effort, given how the market has behaved so far the probability is it's not going to. It's overstretched approaching previous confirmed resistance. The highest probability is it's coming off.

Widespread reversal bar (D) down it goes. But, wait, it doesn't go down easily. It apraoches that previous support area which i've extended across and look at the bars, wide up down bars. That is a battle taking place right there at support. No one could have forseen the wide up down bars but clearly something is happening at an area previously identified. Who will win? Bulls or the bears? Support gets taken out, bears win, down it goes.

I wasn't looking at this when it happened and therefore didn't trade it. Yes it does include a setup of mine which I would have taken. The point is, with a bit of patience and letting the story unfold, relating current action to previous chapters (excuse the book analogy) and time, you can pick these opportunities off even on the pound which isn't the best market.

Lastly, I hope posting the value of wins (in previous post) isn't taken the wrong way. I was merely trying to highlight that increasing trade size can offer decent reward for small moves, whilst managing them correctly.
 

Attachments

  • BP1.png
    BP1.png
    36.9 KB · Views: 176
Hi guys

I do agree with a lot of the comments being said - and even by the guys who do not see the need to source out indicators - that might be an aid for them

I will post my EJ chart again later on today - after taking a scalp sell with an approx 3 pip stop at 141 78/9 this morning

I only kept my 100% scalp sell stake on for a short period and then left a 30% stake on with the stop in profit.

During the last 4 hrs I have added scalp sells under 141 50 and 35 and price now is 141 14 -so in essence a 65+ pip move from a stop of under 5 pips - ie total RR of approx 13 - but I have pumped and peeled on the way down - so I cannot say I have taken a 0 5% stake up like 7% just off one trade.

I would not have the confidence etc to have done this without my own special indicators.

I have also had scalp sells on the GU today - as well as other pairs.

I would love to know what an experienced naked trader expects to achieve on an average monthly basis in terms of rate of return on capital - that being retail size capital accounts under $100k

Sorry I cannot answer T2WBT's question - I have never worked in the industry and therefore my knowledge of how they do really trade is limited to snippets from some ex commercial guys - but all I will say is retail FX trading is really chalk and cheese to the big league and investment trading on multi million dollar account

However having worked at Board level in some large multi national conglomerates - price fixing and competitors working together to distort an industry - goes on all the time. We have already been told that the Libor rate was fixed and as far as I am concerned with the Forex industry being really unregulated - manipulation / price fixing - what ever you want to call it - is happening all the while ;-)

Regards


F
 
Well, without a doubt the huge majority of traders would say they started with indicators such as moving averages, MACD, Bollinger Bands, and the list can go on and on, even myself use couple of them. Whatever the system and methods we are using the reason behind is that we believe those indicators can help to predict the future. All indicators at least most of them are built by using old price information, basically we are using previous information to guide us to make live trading calls, but that is what we do here with or without indicators.
 
Hi Slapshot

I get the feeling you have done your 10k+ hours on live charts and so would say you are a very experienced trader and therefore can understand you not feeling you need to decorate you chart with loads of lines and squiggles and an additional 3 or 4 oscillators.

I have been accused many time of over analysis and in my previous business career loved micro managing etc - so I am probably a bit of an extreme trader etc - and maybe should chill more - rather than try and grab every pip ;-)

I will say though - its great fun - but I have given up trying to compound all the way up to multi millions - with or without indicators - using my own money - so maybe that says to me I know the market is far clever than I can ever be and I wil never forget that fact

Very much enjoyed your input

Good trading


Regards


F
 
I would not have the confidence etc to have done this without my own special indicators.

You probably have, you just don't realise it. Regardless, if it works as is, why change?


I would love to know what an experienced naked trader expects to achieve on an average monthly basis in terms of rate of return on capital - that being retail size capital accounts under $100k

I expect to NOT lose anymore than 2% of my account. The rest takes care of itself.

However having worked at Board level in some large multi national conglomerates - price fixing and competitors working together to distort an industry - goes on all the time. We have already been told that the Libor rate was fixed and as far as I am concerned with the Forex industry being really unregulated - manipulation / price fixing - what ever you want to call it - is happening all the while ;-)

Maybe it does, maybe it doesn't. Does it really matter though? You've got no control over it. Look at it this way, are organisations going to risk £000000's for the sake of taking out some retail stops? Your trade decisions are based on what the market is doing, not whether you think it's being manipulated.


Finally, good trades, well done. I'm afraid though I couldn't make head nor tail of your chart. Looked pretty though :cheesy:
 
Hi Slapshot

I get the feeling you have done your 10k+ hours on live charts and so would say you are a very experienced trader and therefore can understand you not feeling you need to decorate you chart with loads of lines and squiggles and an additional 3 or 4 oscillators.

I have been accused many time of over analysis and in my previous business career loved micro managing etc - so I am probably a bit of an extreme trader etc - and maybe should chill more - rather than try and grab every pip ;-)

I will say though - its great fun - but I have given up trying to compound all the way up to multi millions - with or without indicators - using my own money - so maybe that says to me I know the market is far clever than I can ever be and I wil never forget that fact

Very much enjoyed your input

Good trading


Regards


F

10k and them some. Like I've said, I've had everything on my chart and I mean literally everything. I've blown 4 accounts. I've put my fist through 3 screens and 2 laptops have exited windows. It's consumed my life and affected it very negatively.

I took some time away and made a decision to drop everything. I restarted when I picked up Tom Williams book and that started a new path. I 'got' VSA but found it difficult to implement. But, what happened was I started to 'see' things happening and it that made me want to understand the 'why' things move. Skip forward a few more years and I'm in a better place.

Looking back probably the hardest part of all was being stripped apart having to read a market bar by bar to an experienced trader. Seriously, I thought I knew some stuff until then.

I could sit an type out all the clichés and the statements that get trotted out, but in all honesty trading is not complicated and i don't believe it needs to be made so. Trouble is these days, everyone (not literally) wants a buy and a sell signal. Sit back and watch the cash roll in. It DOES NOT WORK LIKE THAT, unless of course you're peddling a product which people WILL buy because they want the result now.

I never gave up because I knew I could do it. I knew I would find a way. Yes I still have losers and I still make errors and I still trade when I shouldn't. But I'm no longer a slave to it. I trade 2-4ish hours a day. If the opportunities present themselves great if not, oh well there's always tomorrow. And when I'm done, that's it I'm done. Down tools and spend the time trading affords me to be with those that matter the most to me.

Sadly, and I do find this worrying, I think a lot want life given to them on a plate. Hard work is all there is, and it tastes so much sweeter at the other end.

Anyway, bit of a ramble, apologies for that. I'm enjoying this thread, the first on this site for a long time. The sun is shining, I'm off for a beer.
 
. . . I've blown 4 accounts. I've put my fist through 3 screens and 2 laptops have exited windows . . .
Would it be fair to conclude that the market has got under your skin at times Slapshot?
As T2W confessions go - this is one of the best I've read! Glad those days appear to be behind you now, although your IT supplier will be bitterly disappointed!
:p
Tim.
 
Ok, I had a feeling it would end up with charts.

Not my favourite instrument but here's the Pound futures from this morning.

3 opportunities:

A.

Market has rallied from the overnight support and made a new intraday high. Fails to follow through. A look back at that area shows that market broke down yesterday at that point. Will it have another try to break through? No one knows. Price retraces to 84. Here's the key, price rallied, very fast to A and was rejected. The move was too quick to get in, even with the DOM open. That's not the point though. Market retraces once more to the area where it held overnight, and then some chop sideways. Then we have an attempt to break that support and very quickly it held, price rejected the move lower. Rally up to point B.


B.

Now I'm ready, we're approaching the previous rejection area and the time price is hanging around that area is increasing. Price has broken through the resistance line a little bit too much, but we still have weakness and two rejections from the area price brokedown yesterday. Sell short, filled at 89, reduced contract size, stop at the high of the bar, 4 ticks. 2 contracts off at 2 ticks to cover commissions, remaining 2 off at 83 when price starts to hold above support.

Review: not the best trade in the world, but a winner nevertheless. +2 +6 $100 - comms

C. This is where things get interesting. Price respected support and tried to get to the highs of B. It fails, miserably. A wide outside downbar and I'm short at 85. Full size, 8 contracts. Stop at 91, 6 ticks. Immediately price moves down, take 2 contracts off at 2 ticks, stop moved down to -2. Price continues to move lower, lower lows, lower highs. Stop to b/e. Approaching support, no rejection. 2 contracts off at 76 +9, stop set to 81. Price moves sharply to form the intraday low of 69, another 2 off at 70 + 15. Stop moved to 78 in the middle of the support band. Price moves away from 71 with firm closes. Final 2 take off at 74 + 11.

Review: Did I enter when the conditions said so? Yes. Did I manage my risk immediately? Yes. Did I take money off the table where possible? Yes.

+2 +9 + 15 +11 = $462 - comms.


Now, this thread is about whether we need indicators, and as I've said I'm not knocking anyone that uses them. I've posted the chart and my thought processes to (hopefully) show that it's possible to do this without indicators. As you'll see from the chart all I'm looking at is price and time, I watch volume on the DOM, that in itself is very enlightening. There is a lot that I see on the chart which is ingrained in my mind, trendlines, waves, s/r, you know the stuff that you always knew you should look at but usually don't. I've spent hours on those subjects that I now see them without the need to draw them.

I hope this has added positively to the discussion.
What comes across from your post is a trader who is so in touch with the instrument he is trading that indicators are superfluous. I wonder if that is the attraction/need for indicators for those who use them - the fact that they don't feel sufficiently comfortable with what they are trading to understand it without additional overlays. In my case, even with indicators, I find it a struggle.
 
Would it be fair to conclude that the market has got under your skin at times Slapshot?
As T2W confessions go - this is one of the best I've read! Glad those days appear to be behind you now, although your IT supplier will be bitterly disappointed!
:p
Tim.

Lol, yeah you could say that. I have to look back and laugh now.


oh i've been there many a time! Mobile phones have also been punished

I didn't add mobile phones as they fall into the "consumable item" category :D


What comes across from your post is a trader who is so in touch with the instrument he is trading that indicators are superfluous. I wonder if that is the attraction/need for indicators for those who use them - the fact that they don't feel sufficiently comfortable with what they are trading to understand it without additional overlays. In my case, even with indicators, I find it a struggle.

In my first post on this thread I said you have to study your market(s) of choice to the point you can almost 'feel' what they're about to do. I know that sounds a bit odd, but when you've studied it long enough you feel in tune with it. The move to price action was difficult, because it's human nature to want (additional) confirmation on something we're not totally sure about or have any control over (the market).

When I started keeping a diary and training myself to cut my losses, quickly it all came together. It's a long road, but if you're determined it can be done.
 
Last edited:
Top