Chorlton
Established member
- Messages
- 693
- Likes
- 48
Hi Hung,
Just discovered this thread and from what I've read so far seems interesting 🙂
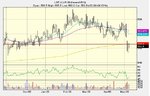
However, could you just confirm what indicators you are using in your charts. It seems that you use 3 MA's, a 200MA and two quicker ones but what is the indicator in the lower window (blue line) ??
Just interested,
Chorlton
Just discovered this thread and from what I've read so far seems interesting 🙂
However, could you just confirm what indicators you are using in your charts. It seems that you use 3 MA's, a 200MA and two quicker ones but what is the indicator in the lower window (blue line) ??
Just interested,
Chorlton