Deep Value

deepvalue

Junior member
Messages
11
Likes
7
I try to keep things pretty simple.

Seeking asymmetrical investment opportunities in the small to mid cap equity sector.

Usually:

(1) Equities trading at a deep discount to net tangible assets, with a catalyst to unlock value.

(2) Cash-flow positive stocks with a low enterprise value, solid corporate governance and a compelling story.

Contrarian.

Long only.

I use leverage.

I will trade the depth, scalp and trade what I feel as long as my net position remains long. I can't quantify this "feeling", but watching the same stocks depth months on end gives you a peripheral feel for it. Some people will know what I mean.

I believe the turning points, in my case the bottom, is where the cream lies. That's where the smart money lies, waiting, patiently. The bottom, for me, comes in the form of cash backing per share, assuming stock is cash flow positive and risk of maintaining earnings in my eyes isn't too great. Pretty simple really.

I encourage constructive debate, that's where we all learn :)
 
I try to keep things pretty simple.

Seeking asymmetrical investment opportunities in the small to mid cap equity sector.
Uh?

(1) Equities trading at a deep discount to net tangible assets, with a catalyst to unlock value.
Ah. Benjamin Graham lives. But not really.

However if he did, I suspect he’d apply his supremely sensible approach to the current markets using precisely the formula you provide, but in mirror image and not restrict himself to long only. A lot of folk have mistaken potential for catalyst where their sense of potential was based on everyone else’s buying into hype. Ben would be shorting the pants out of twitter – a deep premium to net tangible assets with ephemeral potential already factored in.
 
Hi Purple,

Asymmetric? A skewed payoff...... the old make 2,3,4x or lose .5

Ah. Benjamin Graham lives. But not really.

However if he did, I suspect he’d apply his supremely sensible approach to the current markets using precisely the formula you provide, but in mirror image and not restrict himself to long only. A lot of folk have mistaken potential for catalyst where their sense of potential was based on everyone else’s buying into hype. Ben would be shorting the pants out of twitter – a deep premium to net tangible assets with ephemeral potential already factored in.

In my opinion picking a top is a far harder feat than finding a bottom. There's an absence of the sought "safety net" and your at the mercy of sentiment, which by that stage can be void of any logic or rationale. I've seen people successfully trade that side, I don't have the balls.

I agree the value investment landscape has changed since the days of Graham, given the changing dynamics in information flow etc, but opportunities still exist.
 
I am very interested in learning more about the techniques used to do these types of trades/investments. As someone who's normally very far from the world of equities, I am very curious.

Looking fwd...
 
I am very interested in learning more about the techniques used to do these types of trades/investments. As someone who's normally very far from the world of equities, I am very curious.

Looking fwd...

Thanks Martinghoul. Whilst our strategies may differ i'm sure there is some common ground along the way so feel free to chip in wherever you see fit.
 
First trade was initiated at the beginning of December. MCR (ASX) fits my criteria, as a strong balance sheet provides protection to the downside whilst maintining full upside exposure to a host of macro catalysts.

Below is a summary of trades thus far:

Date Description Opening Size Closing Net
6/01/14 Mincor Resources NL 0.55 6006 0.59 +$240.24
6/01/14 Mincor Resources NL 0.565 9994 0.59 +$249.85
27/12/13 Mincor Resources NL 0.525 1400 0.545 +$28
13/12/13 Mincor Resources NL 0.565 10000 0.5325 -$325
6/12/13 Mincor Resources NL 0.505 23300 0.535 +$699

And a summary of current open positions is attached.

I will add to my position this morning, as on Friday it emerged Indonesia physically stopped nickel laden vessels bound for China, enforcing what was expected to be a watered down export ban.

A brief research note I have written below, to see it in more detail please visit:
http://deepspecial.wordpress.com/2013/12/04/mincor-resources-mcr-leveraged-nickel-play/

From the bottom:
- Strong cash balance
- Yield of 10.51% or 13.66% after franking credits (assumption of 3 x .02 dividends over the coming 15 months).
- Highly leveraged to a rebound in Nickel, whilst a strong balance sheet and low production costs provide insulation to further falls (latest production figures of AUD4.39/oz vs LME NI price of AUD6.60/oz
- Top of field management who from a single capital raising of AUD5m in 2001, have generated AUD212m in profits with total franked payouts of over AUD112m. Further, after sailing through the GFC unscathed

Macro catalysts
- Indonesia’s ban on raw mineral exports
- Nickel Prices are cutting deep into the cost curve. Over 60% of global production is unprofitable at these levels and should Nickel continue to trade at current levels we would expect large production scale-backs and mine closures, reducing supply.
- Nickel is priced in USD, therefore any fall in the AUD will inversely increase the AUD NI price. Reserve Bank of Australia’s (RBA) Governor Glen Stevens has threatened intervention should the AUD remain uncomfortable high.
- The inevitable taper, will adversely impact emerging economies and there’s a real threat of an associated slide in commodity prices.The AUD is often referred to as a ‘commodity currency’, that is, it correlates highly with movements in the underlying commodity basket. This can provide the perfect hedge as the USD rises, commodity prices fall dragging the AUD along for the ride.
 

Attachments

  • Screen shot 2014-01-12 at 11.00.52 PM.png
    Screen shot 2014-01-12 at 11.00.52 PM.png
    55.4 KB · Views: 196
Last edited:
Excellent posts and look forward to more. A couple of quick comments: be careful of applying value techniques (esp around tangible net assets) to mining or commodity companies, as a lot of the assets, eg inventory, may be the commodity itself and you have to be confident that it's being held on the balance sheet at a sensible valuation. Even if it is, a sudden lurch downwards in the commodity price can see assets vapourise, as some gold companies found last year. I'd also not be too hung up about catalysts. If it's known, it's to some degree in the price and you're effectively betting on the likelihood of a particular outcome. Value stocks without catalysts are better in my view, as when news comes it often is the bolt from the blue that sees the hidden balance sheet value being unlocked. Good stuff and good luck.

Hi Jack o'Clubs.

Great points indeed.

I'll often look at the Enterprise Value (EV) of a stock. For those who aren't fundamentalists, EV rewards cash and punishes debt & market cap. It's an objective measure and for me provides a great starting point. If you can find stocks with tiny enterprise values, that aren't burning cash then it can afford you the luxury of error on the subjective valuations of further assets such as machinery, property etc etc.

For example, let's say you buy 100% of the local pub on the corner for $1m, inside the till was $1m in cash and the company has no debt. The enterprise Value of the pub is $0 and you are technically getting the pub for free. Incorrect valuation of further assets, such as property, stock, equipment and even intangible assets such as goodwill has very little bearing on your overall risk as the healthy cash balance has you covered on the downside. This also minimises the risk of management inflating values of assets for which we don't really understand.

In MCR's case, I have only looked at the company's EV and not taken into account ore reserves, machinery, plant, equipment etc etc.

At today's AUD nickel price of $7.06/lb, MCRs margin is $2.67/lb or worth AUD$125m on the 21,300/mt of reserves. That alone is worth 66c per share (add in cash and you are already at 97c per share). This to me is an added bonus. So are the "substantial" reserves not accounted due to a conservative cut-off grade. So are the "potentially significant" gold deposits. etc etc etc. To me, these aren't factored into the share price, given MCRs low valuation. I'm not a geologist and I have no edge in trading on the exploration outcome of this information (that being said, I had to educate myself on the global demand/supply NI story to gain further conviction in the trade).

Priority is to focus on how much I can lose. In this case, I believe it's unlikely to trade below their cash balance per share (31c~).

I was willing to pay a higher premium to cash for MCR than I would most others. This is was primarily due to the following three reasons

(a) I love their management

(b) There was a shift in Nickel supply fundamentals early December when the Indonesian government re-iterated their mineral export ban to the surprise of the markets. This to me, was huge and could be the perfect reason for a bottom in the NI market. 60% of Chinas NPI supply vanished overnight, a significant disruption. Now they will rely on lower grade ores from the Philippines which in turn costs more to produce.

(c) 60% of global nickel production was unprofitable at USD6.10/lb...... MCR's cash costs of AUD4.39 give it a true global competitive advantage, and allowed for a further 30% fall in an already challenged market. Nickel can trade slightly down, flat, up and they still make money. A nice buffer. Don't forget, we're technically short the AUD and RBA governor was screaming to keep the AUD below USD.95 so you almost had a free put option given he threatened intervention.

All these factors load the dice in your favour!
 
Last edited:
Another profitable day.

More a function of the market going up. I'm trying to get a little too cute with my scalping, not overly happy as I'm drifting from my objective of trying to catch a larger overall swing.

MCR's quarterly is approaching next week, I will go into a little more detail later but I will most likely look to sell into what I predict will be strength.

Closed Opened Direction Size Opening Closing Funding Comm. P/L
14/01/14 11/12/13 BUY 3,994 0.5500 0.6450 -10.72 -5.78 +362.93
14/01/14 16/12/13 BUY 7,405 0.5250 0.6450 -17.07 -10.69 +860.84
14/01/14 11/12/13 BUY 8,600 0.5250 0.6450 -22.42 -12.43 +997.15
14/01/14 10/01/14 BUY 15,555 0.5550 0.6300 -5.11 -18.43 +1,143.09
14/01/14 14/01/14 BUY 20,000 0.6075 0.6150 - -24.45 +125.05

Open positions attached.
 

Attachments

  • Screen shot 2014-01-14 at 7.29.06 AM.png
    Screen shot 2014-01-14 at 7.29.06 AM.png
    44.1 KB · Views: 175
A ton of volatility in the NI this week, and also the AUD.

ASX nickel stocks are highly sensitive (obviously) to moves in the NI price, but noticeably less sensitive to moves in the AUD.

Assuming no hedged sales, any movement in NI price can either be amplified or offset by a corresponding rise or fall in the AUD. It makes absolutely no difference to the bottom line of MCR if NI rises 10%, or the AUD falls 10%. Theoretically, the stock should trade at exactly the same valuation.

Infact, if I had the choice of either the NI rising or a corresponding drop in the AUD, I’d chose the latter. A low NI price will put pressure on global producers, most likely forcing more out of business, projects would struggle to find funding taking a load of future supply offline. Yet the market reacts with more weight to moves in USD NI price.
It’s good to have this vision, at the end of the day the market will look at the figures and the stock will adjust accordingly, but you can have a little head-start by being aware how the market ineffectively prices a move in the currency.

FURTHER

Last quarterly had negative net movement in cash of $AUD2.82m, however they paid out dividends of $AUD3.76m. So they are still operationally profitable. This stock may not show in most scans/screeners that may filter on positive cash movement.

I’m now at a crossroads with this trade, as the enterprise value has risen my safety net is far lower than when I entered. I love the story, and deep down think it still has a long way to run. But I’m now justifying staying in from an growth in earnings perspective rather than value. A 40k exposure on a 5k account based on future earnings inherits far more risk than a 40k exposure on a value story.

And at the end of the day, the wise man will look at risk and maximum downside as a priority, rather than how much they can make. In the fundamental equity game anyway...
 
Last edited:
Trying not to overcomplicate the situation, however I have been searching for a metric that will quantify whether current price is lagging/leading the movement in Nickel (and hence margins).

I’ve decided to have a look at EV/Margin(mt). The stock in terms of premium to cash backing has started to run away, but by historical EV/Margin valuations the positive movement in underlying margins has yet to be factored into the stock price. Today’s margin can directly impact tomorrows cash balance so not deviating too far away from trade style. Again, there is still heightened risk given the safety net has moved, but it’s still important to look at metrics that impact on positive/negative expectancy.

Risks with this metric:
- For the latest quarter, production costs are unknown so the use of prior quarters figures vs current spot price are backward looking.
- Realised sale price is different to spot price (MCR use average spot LME price 3 months POST month of production).
- These two factors leave us open to months of Macro (NI/AUD movements) and Operational risk.

At the current price of 61c and implied EV/Margin(mt) of .76x, MCR is well below the 8 year mean of 2.37x. If MCR would merely trade at the historical mean we would be looking at a stock price of $1.18. The market is discounting valuations sector wide, given instability of the underlying commodity.

As a stand-alone strategy, if you were simply to buy MCR on a EV/Margin < .8x and sell > 2x (which is still lower than historical average) over the past 8 years you would have achieved the following results:


Date EV/Margin Stock price Result
Buy 01 July 2006 0.65 1.09
Sell 01 November 2006 2.5 4.70 +331.1%

Buy 01 November 2008 0.52 0.52
Sell 01 Dec 2008 4.310.71 +36.5%

Buy 01 September 2011 0.72 0.69
Sell 01 October 2012 2.71 1.2 +73.9%

Buy 01 June 2013 0.72 0.48
Sell *CURRENTLY IN TRADE* 0.61 *unrealised gain +27%

I wouldn’t use this as a standalone strategy. At times this trade triggered, the enterprise value of the stock is quite high, so risk is far greater. This in combination with a value approach can be quite a potent tool. I also haven’t factored historical hedging which may impact the metric. I think the most important aspect of this metric is it keeps you out of the market when valuations are high. By default you buy fear and sell hype.

If AUD NI was to fall -15%, and MCR to trade on historical mean EV/Margin, stock price would still currently be 90c.

I believe this metric proves holding has a positive expectancy, but at the end of the day we are still LONG NI, SHORT AUD, and LONG OPERATIONAL PERFORMANCE. These can all turn around at any point.
 

Attachments

  • Capture.PNG
    Capture.PNG
    19 KB · Views: 196
Last edited:
Sdm

Hi DV, ever looked at SDM.AX?
Last I checked they had cash per share around 0.36 and last year paid 0.05 dividend..leightons is majority shareholder..For me anything under 0.55 is good value..what do you think?
 
Hi DV, ever looked at SDM.AX?
Last I checked they had cash per share around 0.36 and last year paid 0.05 dividend..leightons is majority shareholder..For me anything under 0.55 is good value..what do you think?

Hi Pas,

Yes, SDM is on my watchlist..

Net cash at annual report was 75m...

They put out a note in November, saying deteriorating market will probably mean a 7-8m half year loss. I don't know if this is cash/non cash items but assuming it is that'd put cash down around 31c/ps

Problem with engineering/infrastructure companies is earnings surprises can be far less predictable. You're at the mercy of the client who can, and do can projects. Some of these clients aren't receiving the benefit of the falling AUD either, so no hedge in the falling commodity markets that AUD denominated producers have.

With a producer you have the approx forecast production, cash margins and spot rate which are all the figures you need to manage your own exposure on a day to day basis. There still is operational risk, sovereign etc etc but earnings surprises from decline in commodity prices are already known (and usually priced in, occasionally not which is where we step in :) )

I've also been keeping an eye on GNG, similar boat, however they have a large exposure to Gold which is a metal I don't really follow. Trading at a larger premium to cash but current yield is over 10% which spark interest if it's to fall further from here from the yield hunters.
 
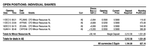
Closed Opened Market Direction Size Opening Closing P/L Funding Borrowing Comm. Total
9/04/14 3/04/14 Mincor Resources NL BUY 22,222 0.66 0.72 1,333.32 -12.93 - -30.45 1,289.94
9/04/14 7/04/14 Mincor Resources NL BUY 22,222 0.66 0.72 1,333.32 -4.34 - -30.45 1,298.53
7/04/14 31/03/14 Sedgman Ltd BUY 13,333 0.47 0.47 -66.67 -6.25 - -6.26 -79.18
2/04/14 27/03/14 Mincor Resources NL BUY 6,329 0.67 0.70 189.87 -3.64 - -16.00 170.23
26/03/14 23/03/14 Sedgman Ltd BUY 7,190 0.47 0.50 215.70 -1.49 - -11.38 202.83
26/03/14 24/03/14 Mincor Resources NL BUY 9,999 0.68 0.69 149.99 -2.91 - -14.90 132.18
26/03/14 24/03/14 Mincor Resources NL BUY 22,222 0.67 0.69 444.44 -6.46 - -30.22 407.76
26/03/14 23/03/14 Sedgman Ltd BUY 2,222 0.47 0.50 66.66 -0.30 - -2.37 63.99
26/03/14 21/03/14 Sedgman Ltd BUY 11,111 0.45 0.50 555.55 -3.70 - -14.67 537.18
26/03/14 25/03/14 Sedgman Ltd BUY 7,000 0.48 0.49 105.00 - - -16.00 89.00
24/03/14 23/03/14 Sedgman Ltd BUY 9,476 0.47 0.47 - - - -12.46 -12.46
21/03/14 20/03/14 Mincor Resources NL BUY 9,925 0.67 0.68 148.88 - - -16.00 132.88
19/03/14 6/03/14 Mincor Resources NL BUY 197 0.63 0.72 17.73 -0.22 - -8.14 9.37
19/03/14 10/03/14 Mincor Resources NL BUY 20,000 0.62 0.72 1,900.00 -13.94 - -26.70 1,859.36
19/03/14 11/03/14 Mincor Resources NL BUY 12,222 0.61 0.72 1,283.31 -8.53 - -16.74 1,258.04
6/03/14 24/02/14 Mincor Resources NL BUY 12,279 0.57 0.62 675.35 -9.61 - -14.55 651.19
6/03/14 5/03/14 Mincor Resources NL BUY 1,580 0.56 0.62 102.70 -0.13 - -8.98 93.59
6/03/14 26/02/14 Mincor Resources NL BUY 1,500 0.56 0.62 90.00 -0.95 - -8.93 80.12
6/03/14 24/02/14 Mincor Resources NL BUY 2,721 0.57 0.60 81.63 -2.13 - -3.16 76.34
6/03/14 24/02/14 Mincor Resources NL BUY 19,501 0.57 0.60 550.40 -15.26 - -22.65 512.49
3/03/14 24/02/14 Mincor Resources NL BUY 9,999 0.57 0.55 -217.74 -5.46 - -13.67 -236.87
25/02/14 24/02/14 Mincor Resources NL BUY 15,000 0.57 0.56 -75.00 -1.21 - -16.88 -93.09
25/02/14 24/02/14 Mincor Resources NL BUY 3,000 0.57 0.56 -20.33 -0.24 - -3.38 -23.95
25/02/14 23/02/14 Mincor Resources NL BUY 2,000 0.57 0.56 -11.93 -0.16 - -2.25 -14.34
24/02/14 23/02/14 Mincor Resources NL BUY 13,000 0.57 0.57 52.43 - - -15.36 37.07
19/02/14 19/02/14 Panoramic Resources Ltd SELL 22,222 0.40 0.42 -444.44 - - -18.00 -462.44
19/02/14 18/02/14 Panoramic Resources Ltd SELL 25,555 0.37 0.39 -383.33 - - -19.30 -402.63
19/02/14 18/02/14 Panoramic Resources Ltd SELL 30,000 0.38 0.39 -300.00 - - -22.80 -322.80
19/02/14 18/02/14 Panoramic Resources Ltd SELL 55,555 0.38 0.39 -555.55 - - -42.22 -597.77
19/02/14 18/02/14 Panoramic Resources Ltd SELL 6,700 0.38 0.39 -67.00 - - -5.26 -72.26
18/02/14 18/02/14 Panoramic Resources Ltd SELL 10,000 0.37 0.36 100.00 - - -8.00 92.00
18/02/14 18/02/14 Panoramic Resources Ltd SELL 13,300 0.38 0.36 199.50 - - -5.32 194.18
18/02/14 17/02/14 Mincor Resources NL BUY 24,999 0.65 0.64 -249.99 -2.27 - -31.99 -284.25
18/02/14 18/02/14 Mincor Resources NL SELL 24,999 0.64 0.62 499.98 - - -31.24 468.74
17/02/14 12/02/14 Mincor Resources NL SELL 10,000 0.62 0.66 -429.17 0.18 -1.05 -6.67 -436.71
17/02/14 16/02/14 Mincor Resources NL BUY 10,000 0.66 0.66 - -0.95 - -6.60 -7.55
17/02/14 16/02/14 Mincor Resources NL BUY 10,000 0.66 0.67 50.00 - - -14.60 35.40
14/02/14 14/02/14 Mincor Resources NL BUY 10,000 0.63 0.64 100.00 - - -16.00 84.00
12/02/14 12/02/14 Mincor Resources NL SELL 2,000 0.62 0.63 -25.83 0.01 -0.04 -2.66 -28.52
12/02/14 12/02/14 Mincor Resources NL SELL 10,000 0.62 0.63 -150.00 0.03 -0.17 -14.67 -164.81
12/02/14 12/02/14 Mincor Resources NL BUY 8,927 0.61 0.62 44.64 - - -14.72 29.92
12/02/14 12/02/14 Mincor Resources NL SELL 1,701 0.62 0.61 8.51 - - -2.33 6.18
12/02/14 12/02/14 Mincor Resources NL BUY 4,445 0.58 0.62 177.80 - - -10.73 167.07
12/02/14 11/02/14 Mincor Resources NL BUY 13,854 0.60 0.62 277.08 - - -16.77 260.31
11/02/14 6/02/14 Mincor Resources NL BUY 18,854 0.56 0.61 942.70 -9.27 - -21.87 911.56
11/02/14 11/02/14 Mincor Resources NL BUY 11,146 0.60 0.61 111.46 - - -13.37 98.09
7/02/14 4/02/14 Mincor Resources NL BUY 6,919 0.56 0.58 105.35 -1.66 - -8.73 94.96
7/02/14 6/02/14 Mincor Resources NL BUY 4,479 0.56 0.58 89.58 -0.36 - -5.63 83.59
5/02/14 5/02/14 ProShares Short VIX Short-Term Futures ETF BUY 50 52.25 51.50 -37.50 - - -30.00 -67.50
4/02/14 2/02/14 Panoramic Resources Ltd SELL 19,000 0.24 0.24 - 0.04 -0.25 -8.00 -8.21
4/02/14 29/01/14 Panoramic Resources Ltd BUY 19,000 0.25 0.24 -95.00 -3.90 - -16.00 -106.90
4/02/14 4/02/14 Mincor Resources NL BUY 636 0.56 0.58 9.68 - - -8.36 1.32
4/02/14 2/02/14 Mincor Resources NL SELL 12,445 0.58 0.56 251.71 0.03 -0.20 -14.19 237.35
2/02/14 23/01/14 Mincor Resources NL BUY 1,555 0.59 0.58 -7.78 -1.41 - -1.81 -11.00
29/01/14 23/01/14 Mincor Resources NL BUY 13,000 0.59 0.58 -130.00 -7.45 - -15.61 -153.06
28/01/14 14/01/14 Mincor Resources NL BUY 3,999 0.63 0.57 -219.95 -4.75 - -4.78 -229.48
28/01/14 20/01/14 Mincor Resources NL BUY 15,555 0.60 0.57 -466.65 -10.27 - -18.20 -295.13
28/01/14 23/01/14 Mincor Resources NL BUY 445 0.59 0.57 -6.68 -0.22 - -0.51 -7.41
27/01/14 14/01/14 Mincor Resources NL BUY 5,926 0.63 0.57 -355.56 -7.10 - -11.70 -374.36
27/01/14 14/01/14 Mincor Resources NL BUY 9,629 0.63 0.57 -577.74 -11.53 - -11.46 -600.73
27/01/14 13/01/14 Mincor Resources NL BUY 18,371 0.60 0.57 -642.99 -22.01 - -21.41 -686.41
27/01/14 14/01/14 Mincor Resources NL BUY 16,000 0.63 0.57 -960.00 -17.70 - -19.04 -996.74
21/01/14 16/12/13 Mincor Resources NL BUY 2,594 0.53 0.60 194.55 -7.82 - -3.81 182.92
21/01/14 13/01/14 Mincor Resources NL BUY 9,406 0.60 0.60 - -6.62 - -11.91 -18.53
14/01/14 11/12/13 Mincor Resources NL BUY 3,994 0.55 0.65 379.43 -10.72 - -5.78 362.93
14/01/14 16/12/13 Mincor Resources NL BUY 7,405 0.53 0.65 888.60 -17.07 - -10.69 860.84
14/01/14 11/12/13 Mincor Resources NL BUY 8,600 0.53 0.65 1,032.00 -22.42 - -12.43 997.15
14/01/14 10/01/14 Mincor Resources NL BUY 15,555 0.56 0.63 1,166.63 -5.11 - -18.43 1,143.09
14/01/14 13/01/14 Mincor Resources NL BUY 20,000 0.61 0.62 149.50 - - -24.45 125.05
6/01/14 11/12/13 Mincor Resources NL BUY 6,006 0.55 0.59 240.24 -12.67 - -8.34 219.23
6/01/14 10/12/13 Mincor Resources NL BUY 9,994 0.57 0.59 249.85 -21.89 - -11.55 216.41
27/12/13 11/12/13 Mincor Resources NL BUY 1,400 0.53 0.55 28.00 -1.59 - -9.12 17.29
13/12/13 10/12/13 Mincor Resources NL BUY 10,000 0.57 0.53 -325.00 -2.32 - -13.65 -340.97
6/12/13 6/12/13 Mincor Resources NL SELL 23,300 0.54 0.51 699.00 - - -24.24 674.76

-308.65 -1,037.50 9,330.37
 
Sorry for the lack of updates.

No. of trades: 71
Starting Balance: £3,000
Current Balance (net of commissions + interest): £8,119

Total comm paid: AUD 1,039
Total interest paid: AUD 308.65
Total costs approx: £740~


One massive oversight, and potential flaw in my strategy, was being unaware that my CFD provider calculated interest daily on the closing price.

This to me was absurd, given I trade DMA, there is no physical roll or transaction ever takes place at the level. Imagine your mortgage interest repayments were calculated on the daily valuation, rather than initial transaction.

I need the leverage that they could provide, so tweaked my strategy with more focus on scalping and catching the 2-3 day swings. I’d say the increase in commission costs is roughly the same (maybe a little more) than the reduction in overnight interest costs. But there is also a reduction in overnight risk as I am holding positions for roughly ½ the of just buy and holding.


MOVING ALONG

I am happy with my results. My initial balance was quite small, however, it was an amount I feel I can aggressively trade with comfort. There’s no way I could replicate this on a 100k account (liquidity would also be an issue).

Don’t know what else to write really. I am constantly paranoid I will get complacent and every day challenge myself why am I profitable? What am I doing to differentiate myself from a bull who merely leveraged into a bull market.

I rarely make money going short, and burned £800 on a speculative punt. Was a nice reminder. Also made a little on SDM, a stock trading close to cash with a strong dividend.

The way the price of NI has moved, MCRs story has turned from value into aggressive growth. I am still massively long in my head, and it kills me to watch from the side-lines as I love the story. But there also is a level of satisfaction knowing you remain disciplined. That’s where the edge lies I guess.
 
Top