Daily News Analysis By Ultima Markets

Ultima markets

Junior member
Messages
15
Likes
0
US-China Agree to 90-Day Tariff Pause, CPI In Focus Next

On May 12, 2025, the United States and China concluded a two-day trade dialogue in Switzerland and reached a significant agreement: both sides will suspend certain tariffs for 90 days and implement mutual tariff reductions of 115%. This marks the first major step toward easing tensions and opening the door for broader discussions on economic and trade issues.
As part of the agreement, the U.S. will lower tariffs on Chinese imports from 145% to 30%, while China will reduce tariffs on U.S. goods from 125% to 10%. The 90-day pause provides a window for continued negotiations aimed at addressing deeper structural differences.
In addition, both countries have agreed to establish a permanent dialogue mechanism, with high-level representatives appointed to maintain regular communication and help prevent future escalations.

Market Reaction: Equities Market Gain on Optimism
The positive comments and the joint statement release by both nation after the two-day talks has sparked an optimism in global market. U.S. Stock market climbed with the S&P500 extend further gain, and Nasdaq 100 regain above the 20,000 mark on Monday. Meanwhile the China A50 also extending into the third day gain on yesterday.
This is good, but investors may still need to remain cautious during the 90-day window and the challenge of enforcing the new term still may pose risk, volatility could resurface if talks stall or a solid progress is lacking between the two world largest economies.
Still, the positive offers much-needed relief for investors, which has been rattled since the tariff announced in April 2.

CPI Data in Focus: What It Means for Markets
Even though the US and China have made progress in trade talks, a 30% tariff is still in place, and deals with other countries are still uncertain. Because of this, higher tariffs since April are still a concern for the economy.
Today’s US Consumer Price Index (CPI) report is an important one. Investors want to see if higher tariffs have pushed up inflation.
If inflation is higher than expected, the Fed may keep interest rates high for longer. That could be bad news for the economy and the stock market. On the flip side, if the CPI comes in lower, markets may hope for earlier rate cuts from the Fed—good news for stocks.

Technical Outlook: SP500 & US Dollar Index
Both the US Dollar and SP500 Index see upside after the promising outlook, reversing the market pessimism earlier when Trump announced the tariff in April, which raise market losing confident in both.
US Dollar Regains 100-Mark
The US Dollar Index (USDX) has bounced after holding firmly above the key 100 level, signaling a possible bullish reversal. It’s now testing resistance around 101.30.
市场热点-內頁 (13).jpg

(USDX+, 4-H Chart Analysis | Source: Ultima Market MT5)

If tonight’s CPI data comes in lower than expected, it could raise hopes for Fed rate cuts—putting short-term pressure on the dollar. However, as long as the index stays above 100, the broader outlook remains positive, and the bullish setup could stay intact.
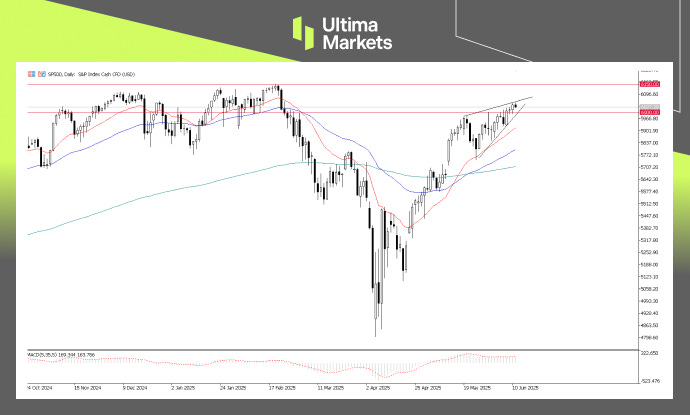
Upside Intact, Watch for Technical Pullback
The SP500 has broken above the 5800 level, confirming a bullish outlook. A softer CPI print could boost hopes for earlier Fed rate cuts, which would support further upside in equities.
市场热点-內頁-1 (8).jpg

(SP500+, Daily Chart | Source: Ultima Market MT5)

However, despite the positive momentum, a short-term technical pullback may occur—offering a potential buy-the-dip opportunity in the uptrend.
Tonight’s U.S. Consumer Price Index (CPI) release may introduce volatility across markets, particularly if the data significantly deviates from expectations.
A stronger-than-expected inflation reading could renew concerns about the longer-term impact of tariffs, potentially putting pressure on both the U.S. Dollar and equity markets. Conversely, a softer or in-line print would likely be welcomed by investors, supporting the current risk sentiment and allowing the recent market momentum to continue.

Disclaimer
Comments, news, research, analysis, price, and all information contained in the article only serve as general information for readers and do not suggest any advice. Ultima Markets has taken reasonable measures to provide up-to-date information, but cannot guarantee accuracy, and may modify without notice. Ultima Markets will not be responsible for any loss incurred due to the application of the information provided.
 

April CPI Sends Mixed Signals: YoY Inflation Cools, But Monthly Price Gains Raise Concerns​


The U.S. inflation picture grew more complicated in April, as the Consumer Price Index (CPI) showed an annual cooling trend but a stronger-than-expected monthly increase. This mixed report could push the Fed to delay any anticipated rate cuts and adds fuel to the ongoing inflation debate.

Data Breakdown: Inflation Cools Annually, But Stickiness Remains​

  • Headline CPI rose by 0.2% month-over-month, reversing March’s -0.1% and surprising markets that expected a further drop.
  • YoY inflation came in at 2.3%, the lowest since early 2021.
  • Core CPI (excluding food and energy) increased by 0.2% MoM and 2.8% YoY, suggesting underlying price pressures are still alive.
These numbers highlight a critical point: while long-term inflation trends may be improving, short-term stickiness could stall any immediate policy shifts.

市场热点-內頁-1 (9).jpg

April US Consumer Price Data | Source: Ultima Market Calendar

Fed Rate Cuts: Postponed Again?​

Despite calls from Trump to lower rates, the Federal Reserve appears to be in no rush. According to CME’s FedWatch tool, the probability of keeping rates steady in July has surged to 61.4%, up sharply from 21.9% just a week ago.

Markets now believe the earliest rate cut may come in September, if at all.

市场热点-內頁-2 (3).jpg

Fed Rate Probabilities for July Meeting | Source: CME Group

Dollar Outlook: Pullback Doesn’t Break Bullish Setup​

The U.S. Dollar Index (USDX) pulled back from the 101.30 resistance after the CPI release but remains well-supported above the 100 level. A bullish crossover in short-term moving averages supports this constructive setup.

With reduced rate cut expectations and improving U.S.–China trade sentiment, the dollar may see continued demand.
市场热点-內頁 (14).jpg

USDX+, 4-H Chart Analysis | Source: Ultima Market MT5

Conclusion​

April’s inflation data reveals a complicated narrative—one that doesn’t yet support a dovish policy shift. With tariffs, trade dynamics, and sticky inflation in play, the Fed’s next steps will likely remain highly dependent on incoming data.

Investors should watch closely for the May and June CPI prints, which could redefine expectations for the second half of 2025.

Disclaimer

Comments, news, research, analysis, price, and all information contained in the article only serve as general information for readers and do not suggest any advice. Ultima Markets has taken reasonable measures to provide up-to-date information, but cannot guarantee accuracy, and may modify without notice. Ultima Markets will not be responsible for any loss incurred due to the application of the information provided.
 

U.S. Credit Rating Downgraded, US Dollar Opens Lower​

Market Overview​

Moody’s downgraded the U.S. credit rating from AAA to AA1 due to rising debt and budget deficits, shaking investor confidence. U.S. stock futures fell, the dollar weakened, and Asian/European markets were mixed. Japanese equities dropped on weak data, while Chinese markets held firm amid trade optimism. The Yen rose as a safe haven, pushing USDJPY lower before recovering.

US Dollar Outlook: Uncertainty Remains​

Despite the downgrade, the U.S. Dollar hasn’t collapsed. Technical support holds above 100.40 on the Dollar Index.
市场热点-內頁 (3).jpg

(Image: US Dollar Index, 4H Chart | Source: Ultima Markets MT5)

The greenback faces headwinds from debt worries but finds support from optimism in U.S.–China trade talks and a 'higher-for-longer' Fed stance.

Upcoming Economic Events​

This Thursday’s S&P Global Flash PMI (May 22) will be key for assessing post-trade policy sentiment. UK and Eurozone data could also impact the USD if results disappoint.

Disclaimer​

Comments, news, research, analysis, price, and all information contained in the article only serve as general information for readers and do not suggest any advice. Ultima Markets has taken reasonable measures to provide up-to-date information, but cannot guarantee accuracy, and may modify without notice. Ultima Markets will not be responsible for any loss incurred due to the application of the information provided.
 

PBoC Cuts LPR to Boost Economy; Markets React, Yuan Slips​

Policy Context and Stimulus Details​

The People’s Bank of China cut its 1-year LPR to 3.0% and the 5-year LPR to 3.5% on May 20, 2025—its first such move since 2024. This is part of broader stimulus efforts aimed at stabilizing growth amid U.S. trade friction, a struggling property sector, and soft domestic demand.

Additional easing tools included reductions in RRR, MLF rate tweaks, and targeted loan programs, signaling a more accommodative monetary stance by the central bank.

What’s Next for Policy?​

Despite Q1 GDP resilience, April retail and trade figures show clear signs of slowing momentum. Analysts expect continued easing from the PBoC to reduce borrowing pressure and revive sentiment.

Ultima Markets senior analyst Shawn noted: “This is a clear commitment from the central bank to backstop the economy.” However, he added that long-term results depend on whether consumer and business confidence improves.

Market Impact and Yuan Outlook​

Stock markets reacted positively. The China A50 rose 0.6%, and the Hang Seng climbed 1%. The offshore yuan, however, weakened modestly as traders priced in a wider U.S.–China yield spread.
市场热点-內頁 (4).jpg

USDCNH Daily Chart Analysis | Source: Ultima Market MT5
The pair dipped below 7.2230 before rebounding. Continued easing may push the yuan lower.
市场热点-內頁-1 (2).jpg

AUDCNH Daily Chart Analysis | Source: Ultima Market MT5
AUD/CNH is consolidating between 4.684–4.610. If the lower bound holds, the pair could test the upper resistance.

Disclaimer​

This content is provided for informational purposes only and does not constitute investment advice. Ultima Markets makes no guarantees on its accuracy and assumes no responsibility for actions taken based on it.
 

U.S. Treasury Yields Surge Amid Rising Fiscal Concerns​

U.S. 30-year yields break above 5.10%, with 10-year yields at 4.6%, as auction demand weakens. Investors react to Moody’s downgrade and policy uncertainty.
美国10、20、30年期国债曲线|图表来源:TradingView.jpg

U.S. Treasury Yield Curve (10Y/20Y/30Y) | Chart Source: TradingView
The 20Y auction required a 5.047% yield to clear. Rising credit risk signals declining investor confidence.

Debt Load and Growth Risks​

Roughly $9.2 trillion in Treasuries will mature in 2025, over half before July. Total debt: $36.21T; interest expense: 16% of federal outlays.
美国债务占GDP预计将增长124.4%|数据来源:FiscalData 美国政府.jpg

2024 Debt-to-GDP Ratio | Source: FiscalData US Government
With yields high and tariffs back in focus, refinancing costs may pressure fiscal stability and long-term USD strength.

Market Impacts: Fragile Sentiment​

If auctions remain weak, yields could stay high, weighing on the Dollar and equities as growth and earnings outlooks dim.

S&P 500 Outlook: Rally Faces Resistance​

The index rallied on China-U.S. trade hopes but now faces technical headwinds. 6000 remains resistance; 5700 is key support.
标普500日线图分析|来源:Ultima Market MT5.jpg

S&P 500 Day Chart Analysis | Source: Ultima Market MT5

Disclaimer​

This content is for informational purposes only and does not constitute investment advice. Ultima Markets does not guarantee accuracy and assumes no liability for reliance on the information provided.
 
Last edited:

Japan Inflation Persists as Growth Slows and Market Volatility Rises​

Key Inflation Data and Policy Implications​

Japan’s April CPI data signals entrenched inflation:

- Headline CPI held at 3.6% YoY, above the BoJ’s 2% target
- Core CPI rose to 3.5%, a 2-year high
- Core-core CPI (ex food and energy) climbed to 3.0%

These readings suggest widespread price pressures, complicating policy decisions.

Growth Weakness and Falling Real Wages​

Despite high inflation, Q1 GDP fell 0.2% QoQ (annualized -0.7%) due to:

- Rising import costs driven by geopolitical tensions and U.S. tariffs
- Wage increases from the Shunto labor talks, but real wages fell 3 consecutive months

Weak household spending power adds complexity to BoJ policy.

日本通脹調整後的實際工資;資料來源:日本政府.jpg

Japan Real Wages Trend | Source: Government of Japan

Bond Market Response and Yield Climb​

Government bond yields surged on inflation and fiscal concerns:
- 10Y JGB yield near 1.65%
- 40Y JGB yield jumped to 3.7%, +100 bps from April

Markets expect potential BoJ tightening in September.

Yen and Asset Market Outlook​

The yen gained support from domestic yields and a weaker dollar but remains sensitive to rate trends and BoJ tone.

- Bonds: Long yields may rise further
- JPY: May strengthen if BoJ turns hawkish and global rates stabilize
- Equities: Higher yields and yen appreciation could pressure profits, especially for exporters

Disclaimer​

This content is provided for informational purposes only and does not constitute investment advice. Ultima Markets does not guarantee its accuracy and assumes no responsibility for actions taken based on it.
 

Trump Delays EU Tariffs, Markets React with Relief​

Market Response: Euro and European Stocks Jump​

President Trump announced a delay in the proposed 50% tariff on EU goods from June 1 to July 9. The euro rose past 1.1400 and the Euro Stoxx 50 futures surged nearly 1.4% at Monday’s open.
EURUSD 四小時圖技術分析|來源:Ultima Markets MT5.jpg

EURUSD 4H Chart Analysis | Source: Ultima Markets MT5

EU50 日線圖技術分析|來源:Ultima Markets MT5.jpg

EU50 Daily Chart Analysis | Source: Ultima Markets MT5

Delay Is Not Resolution: Trade Talks Continue​

While the postponement signals a diplomatic gesture, no substantial agreement was reached. Analysts at Ultima Markets note the situation resembles past U.S.-China talks—cautious optimism is warranted.

Euro Outlook: Key Support Holds​

Technically, EUR/USD holds above 1.1280. A breakout above 1.1400 may extend upside momentum. Fundamentally, dollar weakness from U.S. fiscal concerns supports the euro, but upcoming Fed moves and July negotiations remain key.

European Equities: Rebound Faces Resistance​

EU50 has recovered above 5300, entering a bullish technical structure. However, overhead resistance remains, and consolidation is likely if no new catalysts emerge.

Disclaimer​

This document is for informational purposes only and does not constitute investment advice. Ultima Markets makes no guarantee as to its accuracy and disclaims any liability from reliance upon it.
 

OPEC+ Output Hike Weighs on Oil Prices Ahead of May 31 Meeting​

Oil Stuck Near Pandemic-Era Lows​

Brent and WTI crude prices are hovering near $64 and $61 per barrel respectively—levels not seen since post-COVID lows. Weakness stems from expectations OPEC+ may raise output by 411,000 bpd starting in July, amid rising global trade uncertainties.

UKOUSD 日線圖來源 Ultima Markets MT5.jpg

UKOUSD (Daily Chart) | Source: Ultima Markets MT5

USOUSD 日線圖來源 Ultima Markets MT5.jpg

USOUSD (Daily Chart) | Source: Ultima Markets MT5

Policy Uncertainty Adds Supply-Demand Risk​

U.S. reciprocal tariffs threaten to curb manufacturing and energy use. Any formal OPEC+ output hike would risk oversupply amid faltering global economic momentum.

Demand Weakness Becomes Structural Threat​

The IEA forecasts global oil demand growth for 2025 and 2026 to fall below 1 million barrels/day, marking the weakest 3-year stretch since the pandemic.

年度石油需求成長預估|來源:美國能源資訊署(EIA).jpg

Annual Oil Demand Growth Forecast | Source: U.S. EIA

Key Risks and Watchpoints​

- A confirmed OPEC+ hike could drag oil to new lows
- Trade tension across U.S., China, and Europe may hinder industrial fuel demand
- If major economies stall, crude pricing may revert to pre-recovery ranges

Disclaimer​

This material is provided for informational purposes only and does not constitute investment advice. Ultima Markets makes no representation as to its accuracy and disclaims any liability arising from reliance on it.
 

Australian Inflation Steady, RBA May Pause Further Easing​

Key CPI Figures​

Australia’s annual inflation rate held steady at 2.4% in April 2025, within the RBA’s 2–3% target band. Core inflation rose slightly to 2.8%, casting uncertainty over future rate cuts.

- Headline CPI YoY: 2.4%, unchanged from March and slightly above expectations (2.3%).
- Trimmed Mean CPI: rose from 2.7% to 2.8%.
- Ex-volatile CPI: also up from 2.6% to 2.8%.

Notable price movements:
• Food & non-alcoholic beverages: +3.1%, with egg prices surging 18.6% due to bird flu.
• Housing: +2.2%, with rents up 5.0% annually.
• Recreation & culture: +3.6%
• Fuel: -12%
• Electricity: -6.5%

澳洲每月CPI年增率 資料來源 澳洲統計局 圖表來源 Trading Economics.jpg

Australia Monthly CPI YoY | Source: ABS; Chart from Trading Economics

Policy Outlook: Measured Easing​

The RBA cut its cash rate by 25bps to 3.85% in May, marking the second rate cut this year. While inflation remains within target, the rise in core measures may temper the pace of future easing.

市場利率預期變化 來源 ASX.com.au.jpg

RBA Rate Tracker | Source: ASX.com.au

Market Expectations and Risks​

Before the CPI release, markets priced in a 78% chance of a July cut to 3.60%. However, rising core inflation may shift expectations toward a policy pause pending more data.

In its May statement, the RBA noted inflation may temporarily exceed 3% in the second half of 2025 due to expiring subsidies, before returning to the midpoint of its target range.

Market Reaction and AUDUSD Outlook​

AUD rose slightly, and the ASX 200 hit a 3-month high. AUDUSD remains range-bound between 0.6400–0.6500 in a mild uptrend channel. Without new drivers, short-term consolidation is likely.

AUDUSD 四小時圖技術分析 來源:Ultima Markets MT5.jpg

AUDUSD 4H Chart | Source: Ultima Markets MT5

Disclaimer​

This report is for informational purposes only and does not constitute investment advice. Ultima Markets makes no representation as to its accuracy and accepts no liability for any loss arising from reliance upon it.
 

U.S. Court Rules Trump’s Tariffs Unlawful, Easing Trade Tensions​

Court Ruling Challenges Trade Authority​

A U.S. federal appeals court has ruled that the Trump-era tariffs imposed in 2018 on Chinese imports were procedurally invalid. The decision may overturn billions in levies and limits future executive tariff powers.

Market Turns Risk-On, USD Pulls Back​

Following the ruling, global equities advanced and risk sentiment improved. Emerging market currencies gained, and the U.S. dollar index edged lower.

美元指數日線圖|來源:Ultima Markets MT5.jpg

U.S. Dollar Index (Daily Chart) | Source: Ultima Markets MT5

USD Outlook: Sideways with Support​

While the ruling eases trade friction, investor focus shifts to U.S. economic uncertainty and the Fed’s next steps. DXY technical support lies at 104.5, with resistance around 105.3.

Disclaimer​

This report is for informational purposes only and does not constitute investment advice. Ultima Markets makes no guarantee as to the accuracy of the content and accepts no liability for any loss resulting from reliance upon it.
 

Manufacturing PMI Falls in Both US and China, Recovery Doubts Remain​

US PMI Dips into Contraction Again, USD Weakens Short-Term​

The ISM Manufacturing PMI for the US in May came in at 48.7, below the forecast of 49.5 and slightly down from April’s 49.2, signaling renewed contraction in manufacturing activity. Details were equally weak: new orders dropped from 49.1 to 45.4, the employment index slid from 48.6 to 51.1, while the prices paid index rose from 60.9 to 57.0.

The disappointing report cast doubt over the strength of the US recovery and weighed on the USD. The Fed is expected to hold rates steady in June, but the timing and likelihood of future cuts remain data-dependent.

ISM美國製造業PMI|來源:Ultima Market.jpg

ISM U.S. Manufacturing PMI | Source: Ultima Market

China Caixin PMI Remains Fragile Despite Modest Gain​

China’s Caixin Manufacturing PMI rose slightly to 50.6 in May from 50.4 previously, but the official PMI unexpectedly declined to 49.5 from 50.4, slipping back into contraction. The divergence between the two indicators highlights uneven domestic and external demand recovery.

While production and new orders showed growth in the Caixin report, employment dropped for the 11th straight month and business expectations for the next 12 months turned weaker, indicating the recovery remains uncertain and confidence-lacking.

中國財新製造業PMI|來源:Ultima Market.jpg

China Caixin Manufacturing PMI | Source: Ultima Market

Technical Outlook: Yuan Bears Rebound, Still Ranging Short-Term​

The USDCNH pair found support near the lower trendline of its ascending channel, rebounding from the 7.2550 level after multiple tests. This suggests bearish sentiment around Chinese data has already been priced in.

Technically, moving averages remain upward-sloping, and RSI is not yet overbought, indicating potential for further bullish moves. A break above 7.2800 would target the 7.3000 high, while failure to hold 7.2550 may lead to a retest of 7.2300.

美元兌離岸人民幣日線圖分析|來源:Ultima Market MT5.jpg

USDCNH Daily Chart | Source: Ultima Market MT5

Disclaimer​

Comments, news, research, analysis, price, and all information contained in this article are for informational purposes only and do not constitute investment advice. Ultima Markets has taken reasonable measures to ensure data accuracy, but makes no guarantees and may revise without notice. Ultima Markets assumes no responsibility for any losses resulting from reliance on this information.
 

Tariffs and Export Controls Reignite US-China Trade Tensions​

Trump Doubles Tariffs on Steel and Aluminum​

On Tuesday, President Trump signed a proclamation to double tariffs on imported steel and aluminum from 25% to 50%, citing national security concerns. The new tariffs take effect Wednesday and reflect Trump’s ongoing push to reduce US reliance on foreign metal imports.

According to Trump, the increased tariffs aim to boost domestic production and protect American steelmakers from what he calls “national security” threats. However, this move has alarmed multiple industries, especially manufacturers that heavily rely on imported metals.

For these businesses, raw material costs are likely to surge. As a result, companies may be forced to raise prices, delay production, trim profit margins, cut jobs, or scale back investments.

The immediate market reaction reveals fears of cost-push inflation and a potential deterioration in global trade relations.

China’s Rare Earth Export Restrictions​

At the same time, China’s latest export restrictions on critical minerals are hitting global manufacturers. In April, China suspended exports of several rare earth materials vital to EV batteries, semiconductors, aerospace parts, and military production.

China, which dominates the global rare earth supply chain, has intensified already strained global supply networks with these curbs.

Automakers worldwide—particularly in the US, Europe, and Japan—are voicing concerns about possible delays or factory shutdowns. Industry associations warn that without swift identification of alternative suppliers or diplomatic solutions, production disruptions may affect several strategic sectors.

Broader Implications: A Trade War Again?​

The US’s move to increase tariffs and China’s export restrictions highlight the fragility of US-China trade relations. Although both nations signed a trade deal in May, these new actions indicate that tensions remain unresolved.

Senior US officials suggest that President Trump and President Xi may soon meet to address the escalating friction.

However, China insists that the US must first create the necessary conditions for bilateral relations to return to a “correct path.” While high-level talks remain a possibility, the risk of another trade war cannot be ruled out.

Market Reaction: Gold Surges to One-Month High​

Gold, a traditional safe haven, has rallied sharply over the past two days, hitting its highest level in a month amid growing concerns about global trade tensions.

XAUUSD 四小時圖表分析|資料來源:Ultima Market MT5XAUUSD 四小時圖表分析|資料來源:Ultima Market MT5.jpg

XAUUSD 4-Hour Chart Analysis | Source: Ultima Market MT5

From a technical perspective, gold has broken above the resistance level near 3355 and reached a new high earlier this week. If prices remain firm above this level, further short-term upside is possible.

That said, gold remains within a broad consolidation range. Unless trade tensions significantly escalate, prices may continue to fluctuate sideways.

Disclaimer​

Comments, news, research, analysis, price, and all information contained in this article are for informational purposes only and do not constitute investment advice. Ultima Markets has taken reasonable measures to ensure data accuracy, but makes no guarantee and may revise the information at any time without notice. Ultima Markets shall not be held liable for any loss or damage, including but not limited to lost profits, arising directly or indirectly from the use of or reliance on such information.
 

US Services PMI Shrinks, Tariff Impact Emerges​

New Orders Plunge, Prices Surge​

Following earlier manufacturing PMI data, the US Services PMI for May 2025 unexpectedly contracted. The ISM services index fell from 51.6 in April to 49.9, below the forecasted 52 and marking the first sub-50 reading since June 2024.

A breakdown of the data shows clear weakness in demand. The new orders index tumbled to 46.4, indicating a significant drop in new business.

Meanwhile, inflationary pressures remain elevated. The prices paid index rose to 68.7, the highest since November 2022. Many businesses cited rising input costs due to new tariffs and ongoing supply chain disruptions.

美國服務業PMI|來源:ISM,Trading Economics.jpg

US Services PMI | Source: ISM, Trading Economics

服務業價格指數|來源:ISM,Trading Economics.jpg

Prices Paid Index | Source: ISM, Trading Economics

Are Tariff Effects Starting to Emerge?​

The simultaneous contraction of both manufacturing and services PMIs suggests that the economic impact of recent tariffs is beginning to materialize. Although the US and China partially rolled back tariffs in their early-May agreement, uncertainty and higher import costs persist.

Focus Shifts to NFP Report​

All eyes are now on the US Non-Farm Payrolls (NFP) report due this Friday. It remains the key benchmark for assessing US labor market health.
Markets expect the US to add only 130,000 jobs in May. This aligns with the ADP private payrolls report, which showed just 37,000 new jobs.

Will the Dollar Fall Further?​

The ISM data dragged the US dollar lower on Wednesday. The USD Index (USDX) broke below the critical 99.00 mark again.

Ultima Market analyst Shawn noted: “Although the dollar is under pressure, a key support level remains. If more negative economic signals emerge, downside pressure may intensify.”

美元指數 日線圖分析|來源:Ultima Market MT5.jpg

USD Index Daily Chart | Source: Ultima Market MT5

Disclaimer​

The comments, news, research, analysis, prices, and other information provided in this article are for reference only and do not constitute investment advice. Ultima Markets has taken reasonable measures to ensure accuracy, but does not guarantee absolute correctness and may change content at any time without notice. Ultima Markets shall not be liable for any loss or damage arising directly or indirectly from the use of or reliance on such information, including but not limited to loss of profits.
 

ECB Cuts Rates as Expected; Trump Tariffs Cloud Outlook​

On Thursday, the European Central Bank (ECB) lowered its deposit rate to 2%. ECB President Christine Lagarde noted in the press conference that inflation is nearing the 2% target.

Data shows eurozone inflation in May fell below 2% for the first time in 8 months and only the second time since 2021. This reinforces the ECB's view that the inflation control mission is almost complete.

歐元區通膨數據.jpg

(Eurozone Inflation Data)

Trump’s Tariff Policies a Major Variable​

Trump’s aggressive tariff stance has reintroduced uncertainty to global markets, damaging confidence in the U.S. and casting doubt on global growth prospects.

Lagarde emphasized that the ECB is “ready to respond” to rising trade tensions and European fiscal volatility.

She also acknowledged that the monetary policy cycle is nearing its end after years of navigating overlapping shocks from COVID-19, the Russia-Ukraine war, and the energy crisis.

歐央行政策利率走勢.jpg

(ECB Policy Rate Chart)

Following Lagarde’s comments, market expectations for another ECB rate cut this year have diminished, and traders are no longer fully pricing in a second cut. The euro surged more than 0.6% in response.

歐元兌美元 日線圖分析|來源:Ultima Market MT5.jpg

EUR/USD Daily Chart Analysis | Source: Ultima Market MT5

Technically, while the U.S. dollar remains under pressure, it has yet to break key support levels, suggesting the market awaits further directional signals.

All eyes now turn to the upcoming U.S. non-farm payrolls report. A strong jobs print may trigger a dollar rebound, while weak numbers could prompt deeper correction.

Disclaimer​

The comments, news, research, analysis, prices, and other information provided in this article are for reference only and do not constitute investment advice. Ultima Markets has taken reasonable measures to ensure the accuracy of the data, but does not guarantee its absolute correctness and may revise it at any time without notice. Ultima Markets shall not be held liable for any loss or damage, including but not limited to lost profits, arising directly or indirectly from the use of or reliance on such information.
 
Back
Top