
Daily Market Analytics - Forex

EURJPY Technical Analysis – 12 MAY, 2026
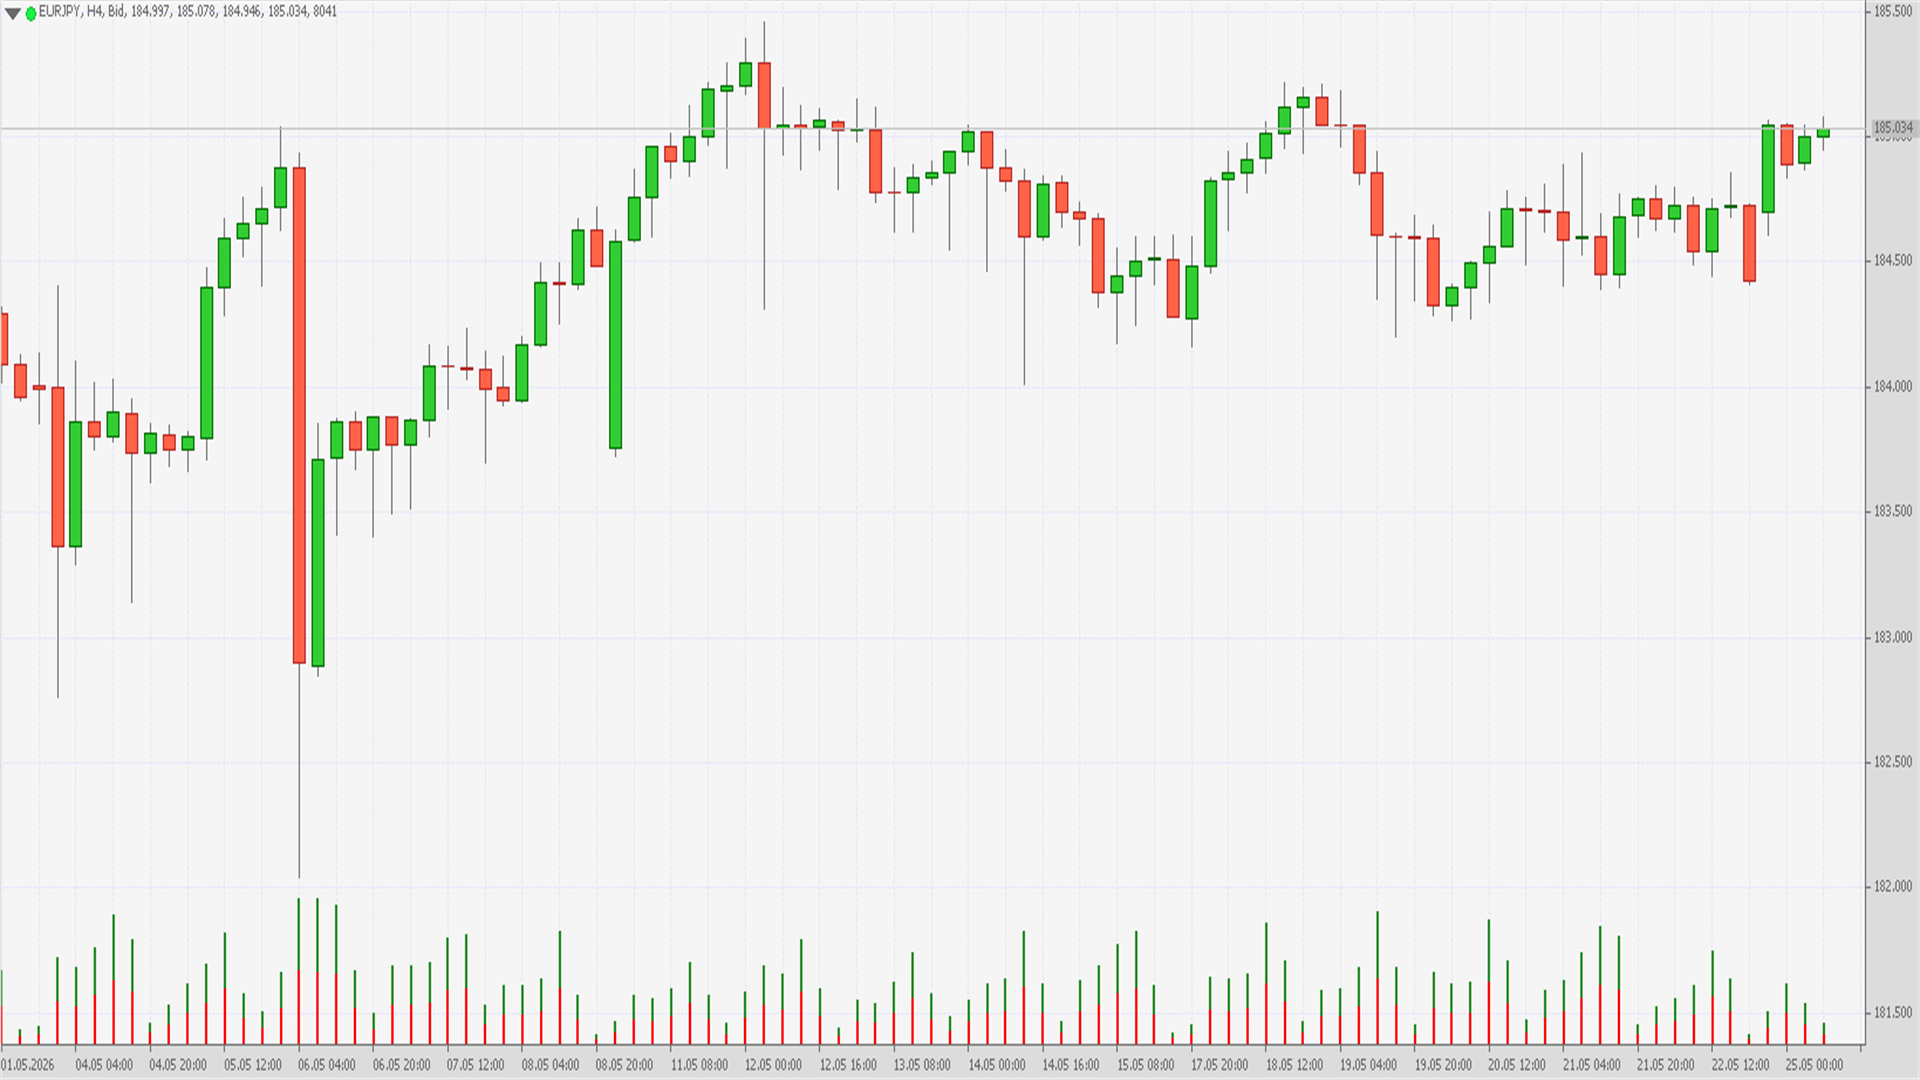
EURJPY – On 12 May 2026, the Euro against the Japanese Yen (EURJPY) registered a significant low at 184.31
PGdo2z1J_o.png


Technical Analysis: EURJPY – Low 184.31 (12 May 2026)

On 12 May 2026, the Euro against the Japanese Yen (EURJPY) registered a significant low at 184.31. This level is particularly important because it reflects the broader dynamics between a currency tied to the European Central Bank’s cautious policy stance and one anchored by the Bank of Japan’s ultra loose monetary framework. The Yen’s role as a funding currency and safe haven asset adds complexity to the pair’s behaviour, making this low a critical point of analysis.

The broader context leading into May 2026 was one of volatility in global markets. The Euro had been under pressure due to uneven growth across the Eurozone and persistent inflationary concerns that limited the ECB’s ability to ease policy. Meanwhile, the Japanese Yen continued to trade with a structural weakness due to the Bank of Japan’s commitment to yield curve control and negative interest rates. However, during periods of heightened risk aversion, the Yen tends to strengthen as investors unwind carry trades, which contributed to EURJPY’s decline toward 184.31.

Technically, the 184.31 low aligns with the lower boundary of a medium term consolidation pattern. Since late 2025, EURJPY has oscillated between 184.00 and 190.00, forming a broad range that reflects indecision among market participants. The retest of 184.31 suggests that this level is acting as a critical support zone. A decisive break below 184.00 would expose the pair to deeper downside risks, with the next support near 182.50, derived from prior swing lows and Fibonacci retracement levels. Conversely, if buyers defend 184.31, the pair could rebound toward resistance at 186.50 and 188.00, where moving averages and prior highs converge.

Momentum indicators provide additional insight. The Relative Strength Index (RSI) hovered near 40 at the time of the low, indicating that the pair was approaching oversold conditions but not yet at extremes. This suggests potential for a corrective bounce. The Moving Average Convergence Divergence (MACD) histogram displayed narrowing negative bars, signaling that bearish momentum was losing intensity. A bullish crossover in the MACD would reinforce the case for recovery. Volume analysis also showed heightened activity around 184.31, implying that institutional investors were actively engaging at this level, possibly accumulating positions in anticipation of stabilization.

Macro drivers remain central to the outlook. The Euro’s trajectory depends on the ECB’s ability to balance inflation control with growth support. Any signs of stronger Eurozone recovery could bolster the currency. The Yen, however, remains heavily influenced by global risk sentiment. During risk off episodes, the Yen tends to strengthen as investors unwind carry trades, while in risk on environments, it weakens as capital flows into higher yielding assets. This dual role makes EURJPY particularly sensitive to shifts in global equity markets and geopolitical developments.

In conclusion, the low at 184.31 marks a pivotal point for EURJPY. If buyers defend this level, a rebound toward 186.50–188.00 is plausible, supported by improving momentum signals. However, a sustained break below 184.00 would expose the pair to deeper downside risks, potentially toward 182.50 or lower. The interplay between Eurozone fundamentals and the Yen’s safe haven dynamics will determine whether this level becomes a durable support or a stepping stone to further declines.

#fxopen #forex #forexanalysis

Disclaimer: This analysis represents my own opinion only. It is not to be construed as an opinion, offer, solicitation, recommendation, or financial advice of the Companies operating under the FXOpen brand.

For in-depth analysis, please check ...
 
EURUSD Technical Analysis – 12 MAY, 2026
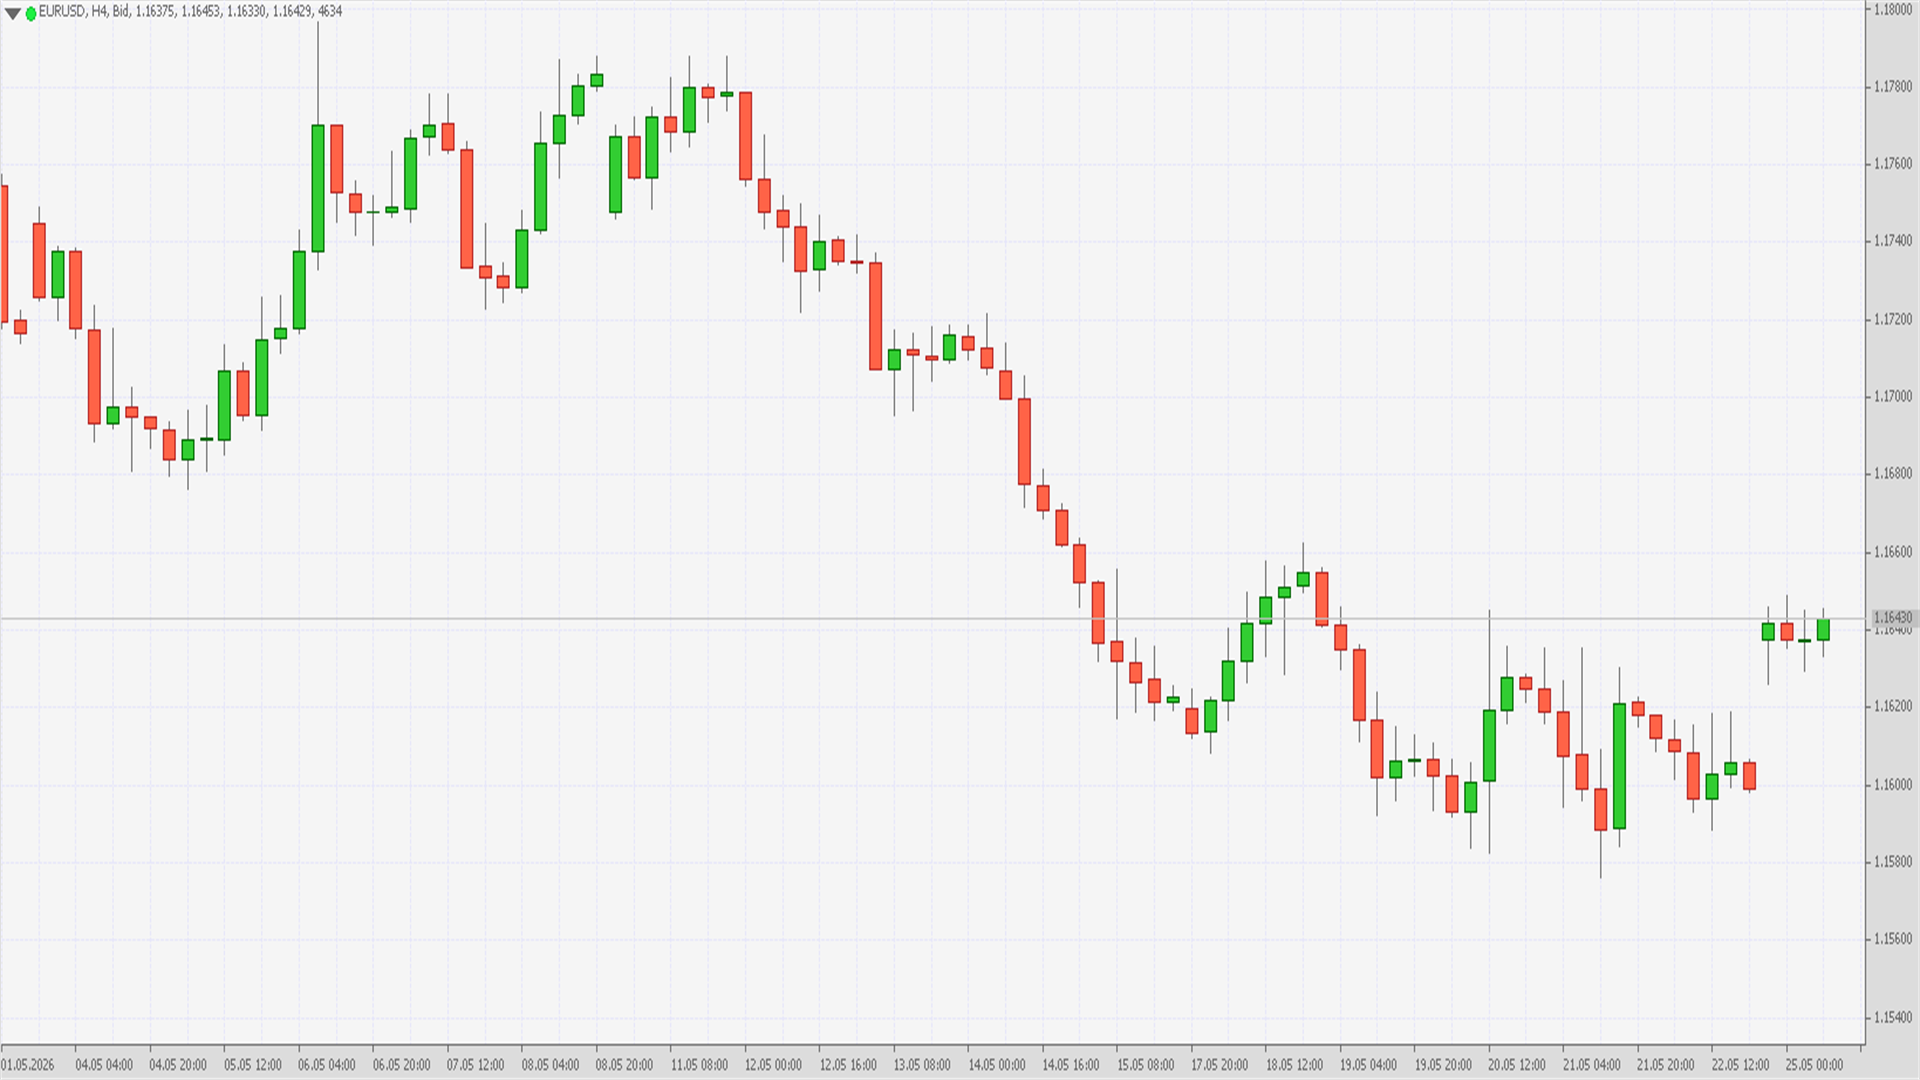
EURUSD – On 12 May 2026, the Euro against the US Dollar (EURUSD) recorded a significant low at 1.1721

gwGJfR5f_o.png


Technical Analysis: EURUSD – Low 1.1721 (12 May 2026)


On 12 May 2026, the Euro against the US Dollar (EURUSD) recorded a significant low at 1.1721. This level is crucial because it reflects the ongoing strength of the US Dollar amid a hawkish Federal Reserve stance and highlights the Euro’s vulnerability in the face of uneven growth across the Eurozone. The move underscores both technical and fundamental pressures that have shaped the pair’s trajectory in recent months.
The broader context leading into May 2026 was dominated by persistent US Dollar strength. The Federal Reserve maintained elevated interest rates to combat inflation, reinforcing demand for the USD. In contrast, the European Central Bank (ECB) adopted a cautious approach, balancing inflationary concerns with fragile growth across member states. This divergence in monetary policy created a structural bias toward Dollar appreciation, pushing EURUSD lower into the 1.1720 region.

From a technical perspective, the 1.1721 low coincides with the lower boundary of a descending channel that has guided price action since late 2025. This channel reflects a series of lower highs and lower lows, confirming the bearish bias. The 1.1720–1.1730 zone has historically acted as a strong support cluster, and its retest suggests that market participants are reassessing whether this level will hold as a durable base or give way to further declines. Should the pair break decisively below 1.1720, the next logical support lies near 1.1650, derived from prior swing lows and Fibonacci retracement levels. A deeper extension could expose the psychologically important 1.1500 threshold.
Resistance levels are equally well defined. The immediate ceiling is at 1.1820, coinciding with the 50 day moving average. A sustained break above this level would signal a potential corrective rebound, opening the path toward 1.1900, where the 200 day moving average converges with prior swing highs. This zone represents a formidable barrier, and only a decisive breach would alter the medium term bearish outlook.

Momentum indicators provide further clarity. The Relative Strength Index (RSI) hovered near 37 at the time of the low, indicating that the pair was approaching oversold territory but not yet at extremes. This positioning suggests potential for a short term bounce. The Moving Average Convergence Divergence (MACD) histogram displayed narrowing negative bars, signalling that bearish momentum was losing intensity. A bullish crossover in the MACD would reinforce the case for recovery. Volume analysis also showed heightened activity around 1.1721, implying that institutional investors were actively engaging at this level, possibly accumulating positions in anticipation of stabilization.
Macro drivers remain central to the outlook. The Euro’s performance is tied to the ECB’s policy trajectory and the broader health of the Eurozone economy. Any signs of stronger growth or inflationary pressures could support the Euro. The US Dollar, however, continues to benefit from safe haven flows and higher yields, particularly during periods of global uncertainty. Geopolitical tensions, equity market volatility, or shifts in risk sentiment tend to favour the Dollar, reinforcing its defensive role. As such, EURUSD’s direction will depend heavily on the balance between Eurozone recovery prospects and US monetary policy strength.

In conclusion, the low at 1.1721 marks a pivotal point for EURUSD. If buyers defend this level, a rebound toward 1.1820–1.1900 is plausible, supported by improving momentum signals. However, a sustained break below 1.1720 would expose the pair to deeper downside risks, potentially toward 1.1650 or even 1.1500. The interplay between ECB caution and Federal Reserve hawkishness will determine whether this level becomes a durable support or a stepping stone to further declines.

#fxopen #forex #forexanalysis

Disclaimer: This analysis represents my own opinion only. It is not to be construed as an opinion, offer, solicitation, recommendation, or financial advice of the Companies operating under the FXOpen brand.

For in-depth analysis, please check ...
 
GBPJPY Technical Analysis – 12 MAY, 2026
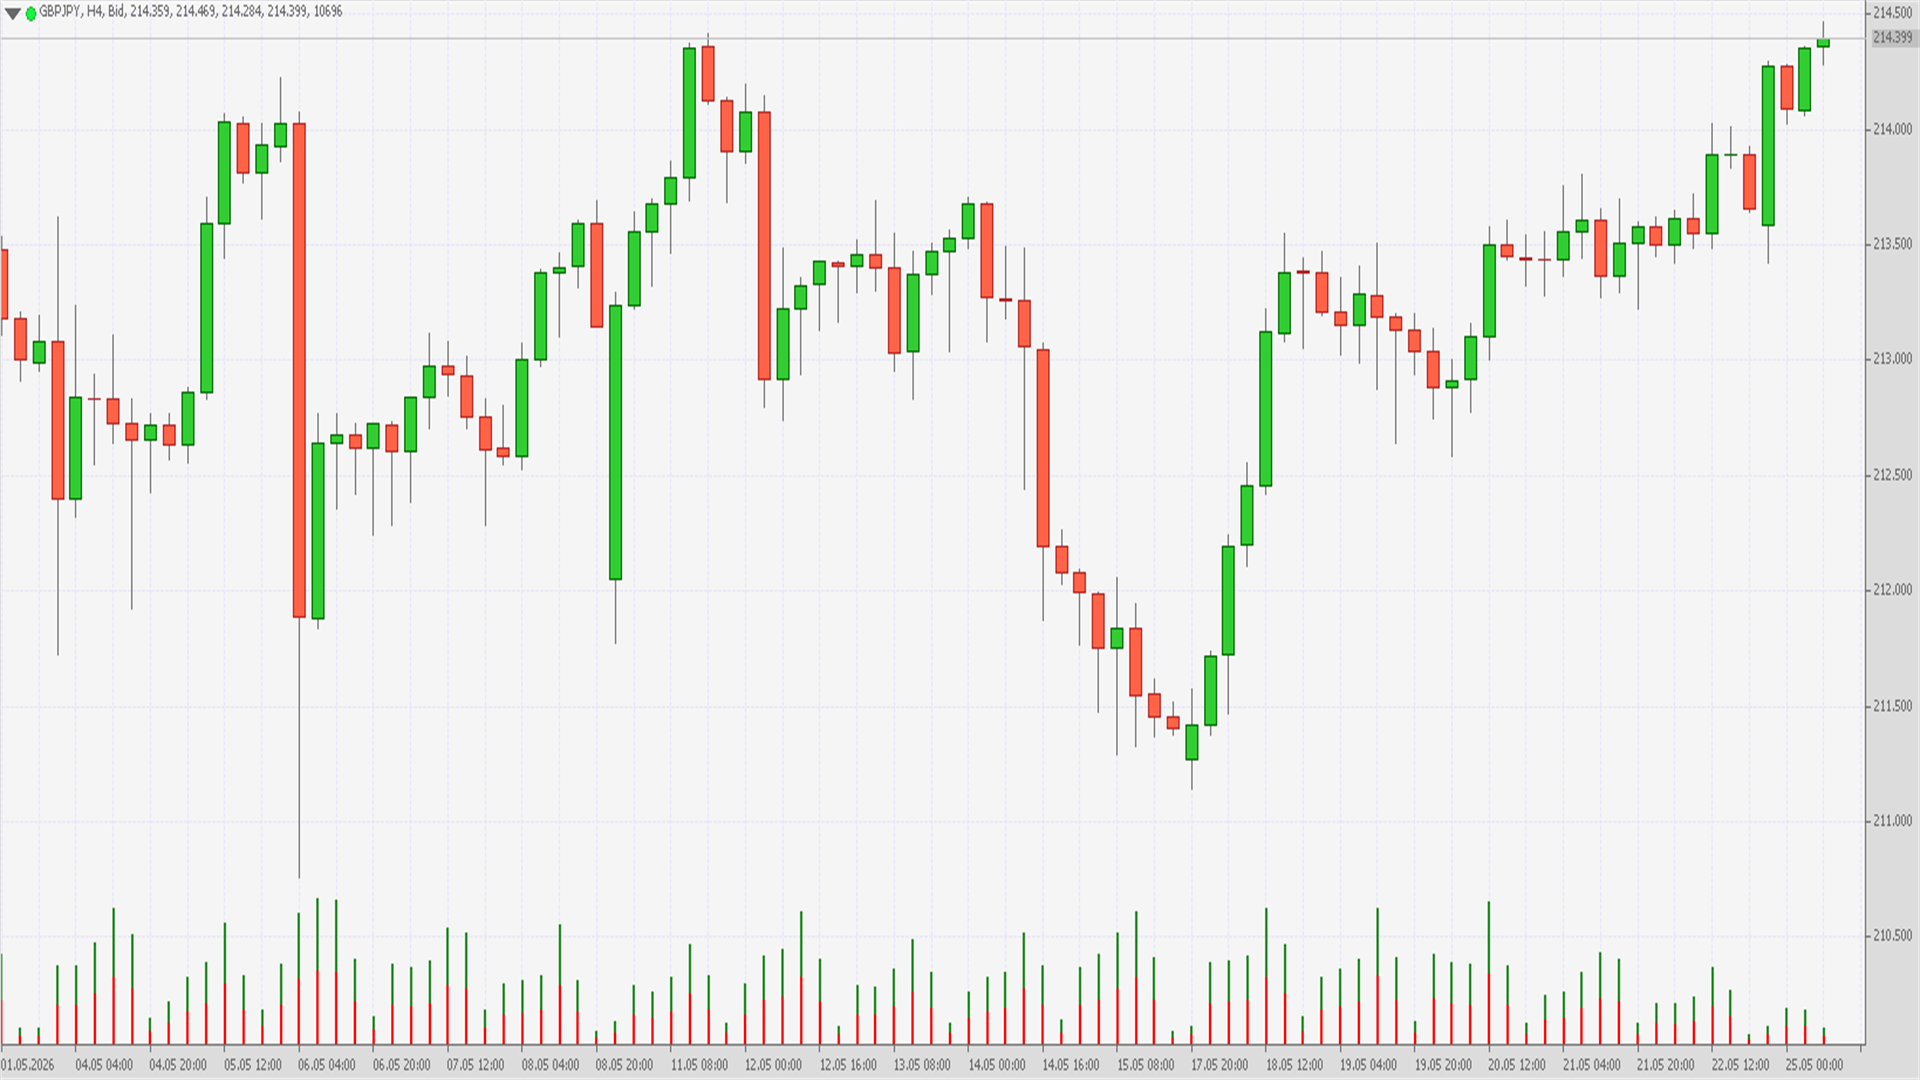
GBPJPY – On 12 May 2026, the British Pound against the Japanese Yen (GBPJPY) reached a notable low at 212.73

yNabYuCE_o.png


Technical Analysis: GBPJPY – Low 212.73 (12 May 2026)

On 12 May 2026, the British Pound against the Japanese Yen (GBPJPY) reached a notable low at 212.73. This level is significant because it reflects the interplay between the Pound’s sensitivity to Bank of England policy and the Yen’s dual role as both a funding currency and a safe haven asset. The move highlights the broader volatility in global markets and the shifting balance between risk appetite and monetary divergence.

The broader context leading into May 2026 was one of sustained volatility in GBPJPY. The Bank of England had maintained a relatively hawkish stance, keeping interest rates elevated to combat persistent inflationary pressures in the UK. However, concerns about slowing growth and political uncertainty weighed on the Pound. The Japanese Yen, meanwhile, continued to trade under structural weakness due to the Bank of Japan’s ultra loose monetary policy, but it strengthened during episodes of risk aversion as investors unwound carry trades. This dynamic contributed to GBPJPY’s decline toward the 212.73 level.

From a technical perspective, the 212.73 low coincides with the lower boundary of a medium term ascending channel that has guided price action since mid 2025. This channel reflects a series of higher highs and higher lows, confirming the broader bullish bias in GBPJPY. The retest of 212.73 suggests that this level is acting as a critical support zone. A decisive break below 212.70 would expose the pair to deeper downside risks, with the next support near 210.50, derived from prior swing lows and Fibonacci retracement levels. Conversely, if buyers defend 212.73, the pair could rebound toward resistance at 215.50 and 218.00, where moving averages and prior highs converge.
Momentum indicators provide further clarity. The Relative Strength Index (RSI) hovered near 39 at the time of the low, indicating that the pair was approaching oversold conditions but not yet at extremes. This positioning suggests potential for a corrective bounce. The Moving Average Convergence Divergence (MACD) histogram displayed narrowing negative bars, signalling that bearish momentum was losing intensity. A bullish crossover in the MACD would reinforce the case for recovery. Volume analysis also showed heightened activity around 212.73, implying that institutional investors were actively engaging at this level, possibly accumulating positions in anticipation of stabilization.

Macro drivers remain central to the outlook. The Pound’s trajectory depends on the Bank of England’s ability to balance inflation control with growth support. Any signs of stronger UK economic resilience could bolster the currency. The Yen, however, remains heavily influenced by global risk sentiment. During risk off episodes, the Yen tends to strengthen as investors unwind carry trades, while in risk on environments, it weakens as capital flows into higher yielding assets. This dual role makes GBPJPY particularly sensitive to shifts in global equity markets and geopolitical developments.

In conclusion, the low at 212.73 marks a pivotal point for GBPJPY. If buyers defend this level, a rebound toward 215.50–218.00 is plausible, supported by improving momentum signals. However, a sustained break below 212.70 would expose the pair to deeper downside risks, potentially toward 210.50 or lower. The interplay between Bank of England policy and the Yen’s safe haven dynamics will determine whether this level becomes a durable support or a stepping stone to further declines.

#fxopen #forex #forexanalysis

Disclaimer: This analysis represents my own opinion only. It is not to be construed as an opinion, offer, solicitation, recommendation, or financial advice of the Companies operating under the FXOpen brand.

For in-depth analysis, please check ...
 
GBPUSD Technical Analysis – 12 MAY, 2026
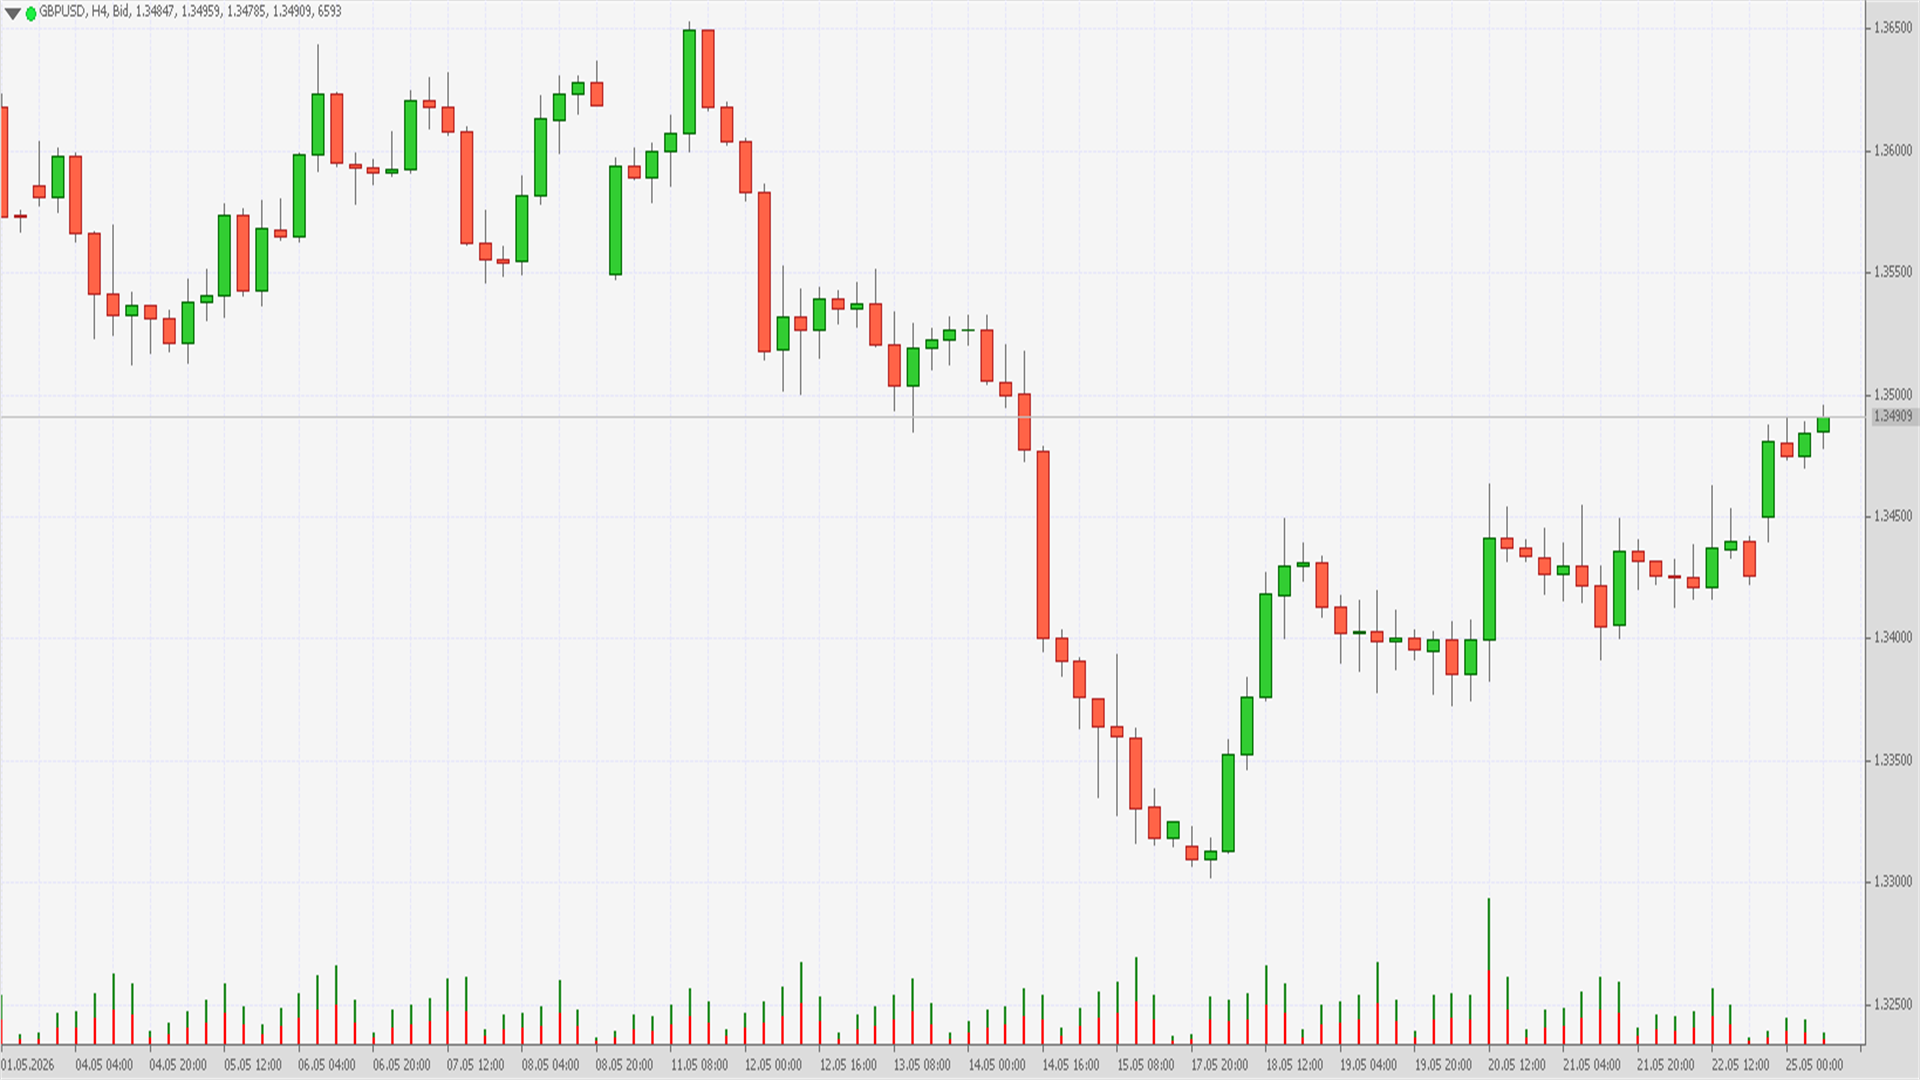
GBPUSD – On 12 May 2026, the British Pound against the US Dollar (GBPUSD) recorded a significant low at 1.3500

spval9Zm_o.png


Technical Analysis: GBPUSD – Low 1.3500 (12 May 2026)

On 12 May 2026, the British Pound against the US Dollar (GBPUSD) recorded a significant low at 1.3500. This level is important because it reflects the ongoing strength of the US Dollar amid a hawkish Federal Reserve stance and highlights the Pound’s vulnerability in the face of domestic economic challenges and political uncertainty. The move underscores both technical and fundamental pressures that have shaped the pair’s trajectory in recent months.
The broader context leading into May 2026 was dominated by persistent US Dollar strength. The Federal Reserve maintained elevated interest rates to combat inflation, reinforcing demand for the USD. In contrast, the Bank of England faced a difficult balancing act. While inflationary pressures remained elevated, growth indicators in the UK showed signs of weakness, limiting the central bank’s ability to tighten policy further. This divergence in monetary policy created a structural bias toward Dollar appreciation, pushing GBPUSD lower into the 1.3500 region.

From a technical perspective, the 1.3500 low coincides with the lower boundary of a descending channel that has guided price action since late 2025. This channel reflects a series of lower highs and lower lows, confirming the bearish bias. The 1.3500 level itself is psychologically significant, acting as a round number support that traders often monitor closely. A decisive break below 1.3500 would expose the pair to deeper downside risks, with the next logical support near 1.3400, derived from prior swing lows and Fibonacci retracement levels. A deeper extension could expose the psychologically important 1.3200 threshold.

Resistance levels are equally well defined. The immediate ceiling is at 1.3600, coinciding with the 50 day moving average. A sustained break above this level would signal a potential corrective rebound, opening the path toward 1.3720, where the 200 day moving average converges with prior swing highs. This zone represents a formidable barrier, and only a decisive breach would alter the medium term bearish outlook.

Momentum indicators provide further clarity. The Relative Strength Index (RSI) hovered near 36 at the time of the low, indicating that the pair was approaching oversold territory but not yet at extremes. This positioning suggests potential for a short term bounce. The Moving Average Convergence Divergence (MACD) histogram displayed narrowing negative bars, signalling that bearish momentum was losing intensity. A bullish crossover in the MACD would reinforce the case for recovery. Volume analysis also showed heightened activity around 1.3500, implying that institutional investors were actively engaging at this level, possibly accumulating positions in anticipation of stabilization.
Macro drivers remain central to the outlook. The Pound’s performance is tied to the Bank of England’s policy trajectory and the broader health of the UK economy. Any signs of stronger growth or inflationary pressures could support the currency. The US Dollar, however, continues to benefit from safe haven flows and higher yields, particularly during periods of global uncertainty. Geopolitical tensions, equity market volatility, or shifts in risk sentiment tend to favour the Dollar, reinforcing its defensive role. As such, GBPUSD’s direction will depend heavily on the balance between UK recovery prospects and US monetary policy strength.

In conclusion, the low at 1.3500 marks a pivotal point for GBPUSD. If buyers defend this level, a rebound toward 1.3600–1.3720 is plausible, supported by improving momentum signals. However, a sustained break below 1.3500 would expose the pair to deeper downside risks, potentially toward 1.3400 or even 1.3200. The interplay between Bank of England caution and Federal Reserve hawkishness will determine whether this level becomes a durable support or a stepping stone to further declines.

#fxopen #forex #forexanalysis

Disclaimer: This analysis represents my own opinion only. It is not to be construed as an opinion, offer, solicitation, recommendation, or financial advice of the Companies operating under the FXOpen brand.

For in-depth analysis, please check ...
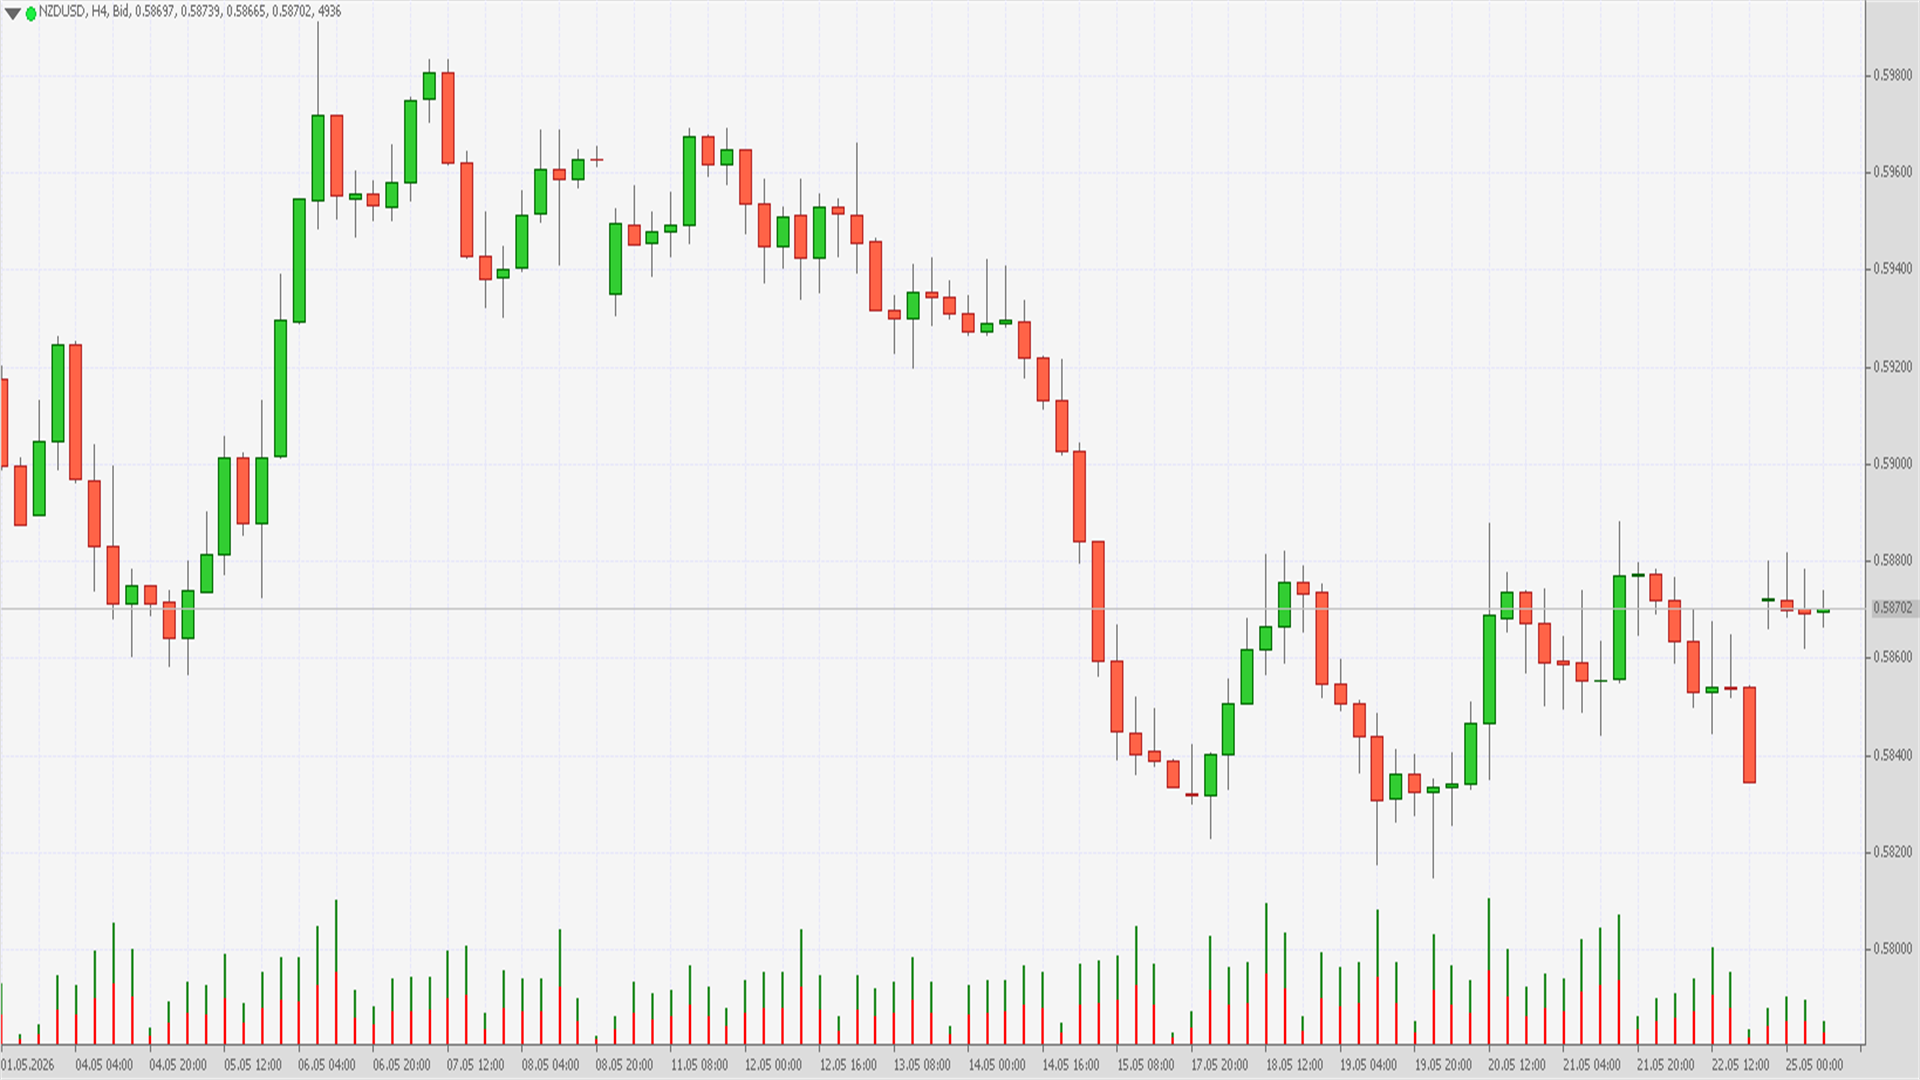
 
NZDUSD Technical Analysis – 12 MAY, 2026
NZDUSD – On 12 May 2026, the New Zealand Dollar against the US Dollar (NZDUSD) registered a significant low at 0.5934

spDGTqOI_o.png


Technical Analysis: NZDUSD – Low 0.5934 (12 May 2026)

On 12 May 2026, the New Zealand Dollar against the US Dollar (NZDUSD) registered a significant low at 0.5934. This level is critical because it reflects both the structural weakness of the New Zealand Dollar amid subdued domestic growth and the persistent strength of the US Dollar under a hawkish Federal Reserve. The move underscores the vulnerability of commodity linked currencies in a global environment dominated by tight monetary conditions and risk averse sentiment.

The broader context leading into May 2026 was one of sustained US Dollar dominance. The Federal Reserve’s commitment to elevated interest rates kept yields attractive, reinforcing demand for the USD. In contrast, the Reserve Bank of New Zealand (RBNZ) faced challenges in balancing inflationary pressures with slowing growth. Agricultural exports, which are central to New Zealand’s economy, had shown signs of weakness due to softer global demand, further undermining the NZD. This divergence in fundamentals created a structural bias toward Dollar appreciation, pushing NZDUSD lower into the 0.5930 region.

From a technical perspective, the 0.5934 low coincides with the lower boundary of a descending channel that has guided price action since late 2025. This channel reflects a series of lower highs and lower lows, confirming the bearish bias. The 0.5930–0.5940 zone has historically acted as a strong support cluster, and its retest suggests that market participants are reassessing whether this level will hold as a durable base or give way to further declines. Should the pair break decisively below 0.5930, the next logical support lies near 0.5850, derived from prior swing lows and Fibonacci retracement levels. A deeper extension could expose the psychologically important 0.5700 threshold.

Resistance levels are equally well defined. The immediate ceiling is at 0.6020, coinciding with the 50 day moving average. A sustained break above this level would signal a potential corrective rebound, opening the path toward 0.6150, where the 200 day moving average converges with prior swing highs. This zone represents a formidable barrier, and only a decisive breach would alter the medium term bearish outlook.

Momentum indicators provide further clarity. The Relative Strength Index (RSI) hovered near 34 at the time of the low, indicating that the pair was approaching oversold territory. This positioning suggests potential for a corrective bounce. The Moving Average Convergence Divergence (MACD) histogram displayed narrowing negative bars, signalling that bearish momentum was losing intensity. A bullish crossover in the MACD would reinforce the case for recovery. Volume analysis also showed heightened activity around 0.5934, implying that institutional investors were actively engaging at this level, possibly accumulating positions in anticipation of stabilization.

Macro drivers remain central to the outlook. The New Zealand Dollar’s performance is tied to the RBNZ’s policy trajectory and the broader health of the agricultural export sector. Any rebound in global demand for dairy and meat products could provide tailwinds for the currency. The US Dollar, however, continues to benefit from safe haven flows and higher yields, particularly during periods of global uncertainty. Geopolitical tensions, equity market volatility, or shifts in risk sentiment tend to favour the Dollar, reinforcing its defensive role. As such, NZDUSD’s direction will depend heavily on the balance between New Zealand’s export resilience and US monetary policy strength.

In conclusion, the low at 0.5934 marks a pivotal point for NZDUSD. If buyers defend this level, a rebound toward 0.6020–0.6150 is plausible, supported by improving momentum signals. However, a sustained break below 0.5930 would expose the pair to deeper downside risks, potentially toward 0.5850 or even 0.5700. The interplay between RBNZ caution and Federal Reserve hawkishness will determine whether this level becomes a durable support or a stepping stone to further declines.

#fxopen #forex #forexanalysis

Disclaimer: This analysis represents my own opinion only. It is not to be construed as an opinion, offer, solicitation, recommendation, or financial advice of the Companies operating under the FXOpen brand.

For in-depth analysis, please check ...
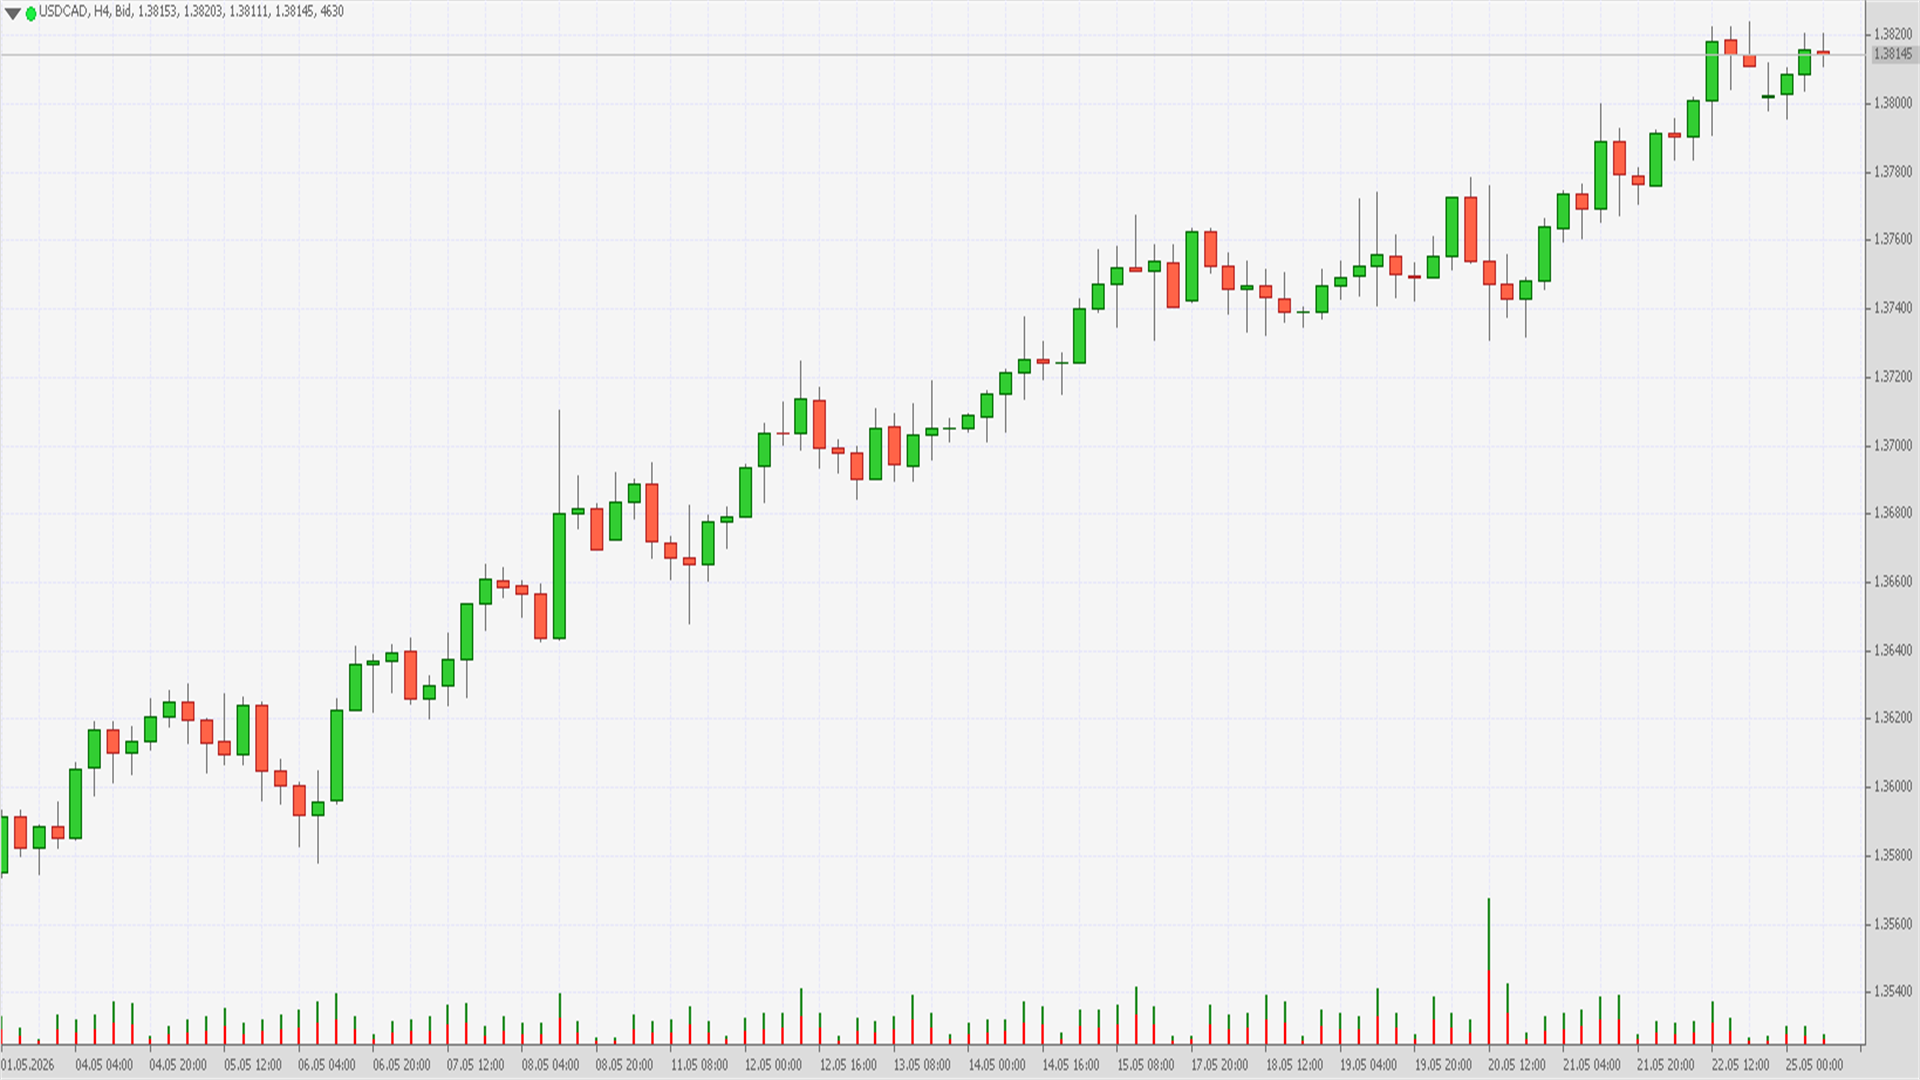
 
USDCAD Technical Analysis – 12 MAY, 2026
USDCAD – On 12 May 2026, the US Dollar against the Canadian Dollar (USDCAD) reached a significant high at 1.3724

2qClijEl_o.png


Technical Analysis: USDCAD – High 1.3724 (12 May 2026)

On 12 May 2026, the US Dollar against the Canadian Dollar (USDCAD) reached a significant high at 1.3724. This level is important because it reflects the persistent strength of the US Dollar amid a hawkish Federal Reserve stance and highlights the Canadian Dollar’s vulnerability in the face of softer commodity prices and domestic economic challenges. The move underscores both technical and fundamental forces that have shaped the pair’s trajectory in recent months.

The broader context leading into May 2026 was dominated by US Dollar resilience. The Federal Reserve maintained elevated interest rates to combat inflation, reinforcing demand for the USD. In contrast, the Bank of Canada faced a more delicate balancing act. While inflationary pressures remained present, growth indicators in Canada showed signs of weakness, limiting the central bank’s ability to tighten policy further. Additionally, crude oil prices, a key driver of the Canadian Dollar, had softened, undermining CAD’s support. This divergence in fundamentals created a structural bias toward Dollar appreciation, pushing USDCAD higher into the 1.3720 region.

From a technical perspective, the 1.3724 high coincides with the upper boundary of a medium term ascending channel that has guided price action since late 2025. This channel reflects a series of higher highs and higher lows, confirming the bullish bias. The 1.3720–1.3730 zone has historically acted as a strong resistance cluster, and its retest suggests that market participants are reassessing whether this level will cap further gains or give way to a breakout. Should the pair break decisively above 1.3730, the next logical resistance lies near 1.3800, derived from prior swing highs and Fibonacci extension levels. A deeper extension could expose the psychologically important 1.4000 threshold.

Support levels are equally well defined. The immediate floor is at 1.3620, coinciding with the 50 day moving average. A sustained break below this level would signal a potential corrective pullback, opening the path toward 1.3500, where the 200 day moving average converges with prior swing lows. This zone represents a formidable cushion, and only a decisive breach would alter the medium term bullish outlook.

Momentum indicators provide further clarity. The Relative Strength Index (RSI) hovered near 64 at the time of the high, indicating that the pair was approaching overbought territory. This positioning suggests potential for a short term consolidation or pullback. The Moving Average Convergence Divergence (MACD) histogram displayed widening positive bars, signalling that bullish momentum remained strong. However, any narrowing of these bars would hint at waning momentum. Volume analysis also showed heightened activity around 1.3724, implying that institutional investors were actively engaging at this level, possibly taking profits or positioning for a breakout.

Macro drivers remain central to the outlook. The Canadian Dollar’s performance is tied to the Bank of Canada’s policy trajectory and the broader health of the energy sector. Any rebound in crude oil prices could provide tailwinds for CAD. The US Dollar, however, continues to benefit from safe haven flows and higher yields, particularly during periods of global uncertainty. Geopolitical tensions, equity market volatility, or shifts in risk sentiment tend to favour the Dollar, reinforcing its defensive role. As such, USDCAD’s direction will depend heavily on the balance between Canadian energy resilience and US monetary policy strength.

In conclusion, the high at 1.3724 marks a pivotal point for USDCAD. If sellers cap this level, a pullback toward 1.3620–1.3500 is plausible, supported by overbought momentum signals. However, a sustained break above 1.3730 would expose the pair to further upside risks, potentially toward 1.3800 or even 1.4000. The interplay between Bank of Canada caution and Federal Reserve hawkishness will determine whether this level becomes a durable resistance or a stepping stone to further gains.

#fxopen #forex #forexanalysis

Disclaimer: This analysis represents my own opinion only. It is not to be construed as an opinion, offer, solicitation, recommendation, or financial advice of the Companies operating under the FXOpen brand.

For in-depth analysis, please check ...
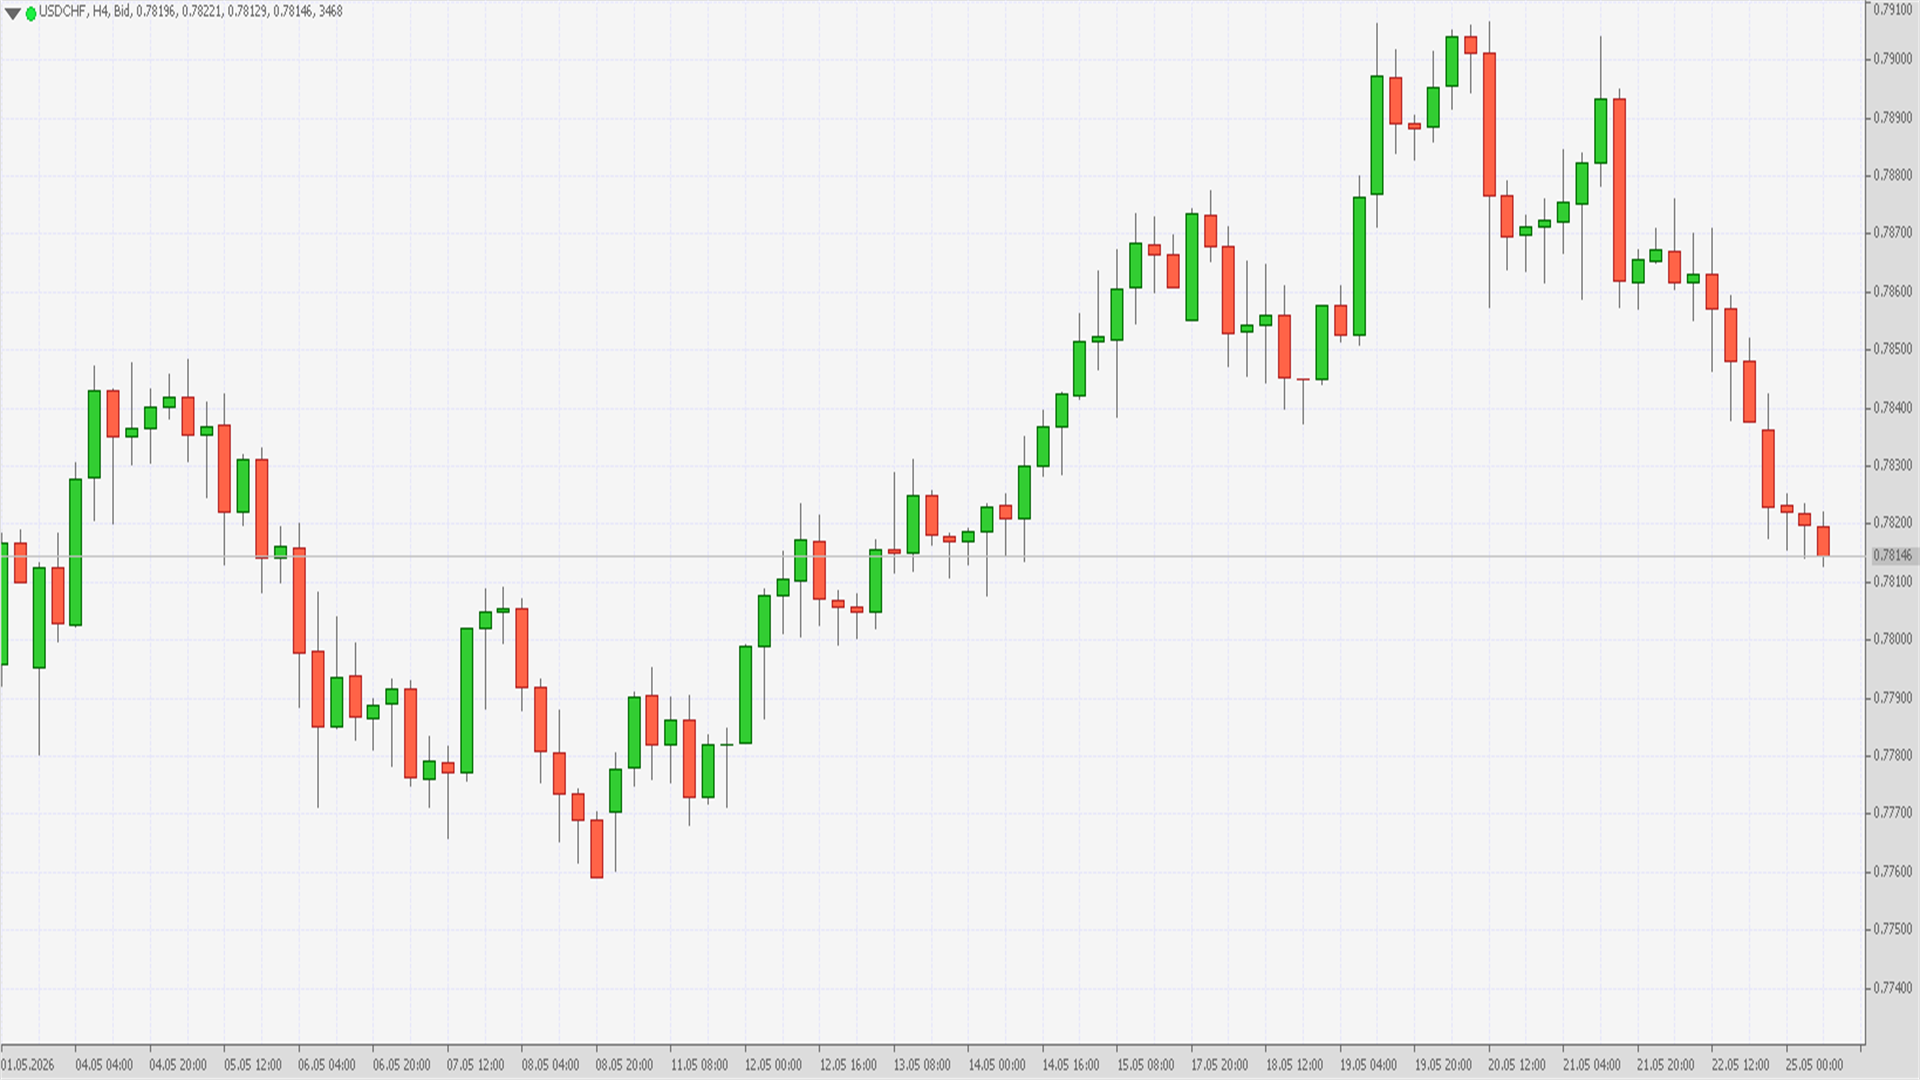
 
USDCHF Technical Analysis – 12 MAY, 2026
USDCHF – On 12 May 2026, the US Dollar against the Swiss Franc (USDCHF) reached a notable high at 0.7823

RAhGkPfT_o.png


Technical Analysis: USDCHF – High 0.7823 (12 May 2026)

On 12 May 2026, the US Dollar against the Swiss Franc (USDCHF) reached a notable high at 0.7823. This level is significant because it reflects the persistent strength of the US Dollar amid a hawkish Federal Reserve stance and highlights the Swiss Franc’s relative weakness despite its traditional safe haven appeal. The move underscores both technical and fundamental dynamics that have shaped the pair’s trajectory in recent months.

The broader context leading into May 2026 was dominated by US Dollar resilience. The Federal Reserve maintained elevated interest rates to combat inflation, reinforcing demand for the USD. In contrast, the Swiss National Bank (SNB) continued to emphasize stability, but its relatively accommodative stance limited the Franc’s ability to appreciate. Additionally, global investors favoured the Dollar over the Franc as a safe haven asset, given higher yields and stronger liquidity. This divergence in fundamentals created a structural bias toward Dollar appreciation, pushing USDCHF higher into the 0.7820 region.

From a technical perspective, the 0.7823 high coincides with the upper boundary of a medium term ascending channel that has guided price action since late 2025. This channel reflects a series of higher highs and higher lows, confirming the bullish bias. The 0.7820–0.7830 zone has historically acted as a strong resistance cluster, and its retest suggests that market participants are reassessing whether this level will cap further gains or give way to a breakout. Should the pair break decisively above 0.7830, the next logical resistance lies near 0.7900, derived from prior swing highs and Fibonacci extension levels. A deeper extension could expose the psychologically important 0.8000 threshold.

Support levels are equally well defined. The immediate floor is at 0.7720, coinciding with the 50 day moving average. A sustained break below this level would signal a potential corrective pullback, opening the path toward 0.7600, where the 200 day moving average converges with prior swing lows. This zone represents a formidable cushion, and only a decisive breach would alter the medium term bullish outlook.

Momentum indicators provide further clarity. The Relative Strength Index (RSI) hovered near 66 at the time of the high, indicating that the pair was approaching overbought territory. This positioning suggests potential for a short term consolidation or pullback. The Moving Average Convergence Divergence (MACD) histogram displayed widening positive bars, signalling that bullish momentum remained strong. However, any narrowing of these bars would hint at waning momentum. Volume analysis also showed heightened activity around 0.7823, implying that institutional investors were actively engaging at this level, possibly taking profits or positioning for a breakout.

Macro drivers remain central to the outlook. The Swiss Franc’s performance is tied to the SNB’s policy trajectory and its safe haven role. Any escalation in geopolitical tensions or global risk aversion could bolster the Franc. The US Dollar, however, continues to benefit from safe haven flows and higher yields, particularly during periods of global uncertainty. Geopolitical tensions, equity market volatility, or shifts in risk sentiment tend to favour the Dollar, reinforcing its defensive role. As such, USDCHF’s direction will depend heavily on the balance between SNB caution and Federal Reserve hawkishness.

In conclusion, the high at 0.7823 marks a pivotal point for USDCHF. If sellers cap this level, a pullback toward 0.7720–0.7600 is plausible, supported by overbought momentum signals. However, a sustained break above 0.7830 would expose the pair to further upside risks, potentially toward 0.7900 or even 0.8000. The interplay between SNB policy and Federal Reserve strength will determine whether this level becomes a durable resistance or a stepping stone to further gains.

#fxopen #forex #forexanalysis

Disclaimer: This analysis represents my own opinion only. It is not to be construed as an opinion, offer, solicitation, recommendation, or financial advice of the Companies operating under the FXOpen brand.

For in-depth analysis, please check ...
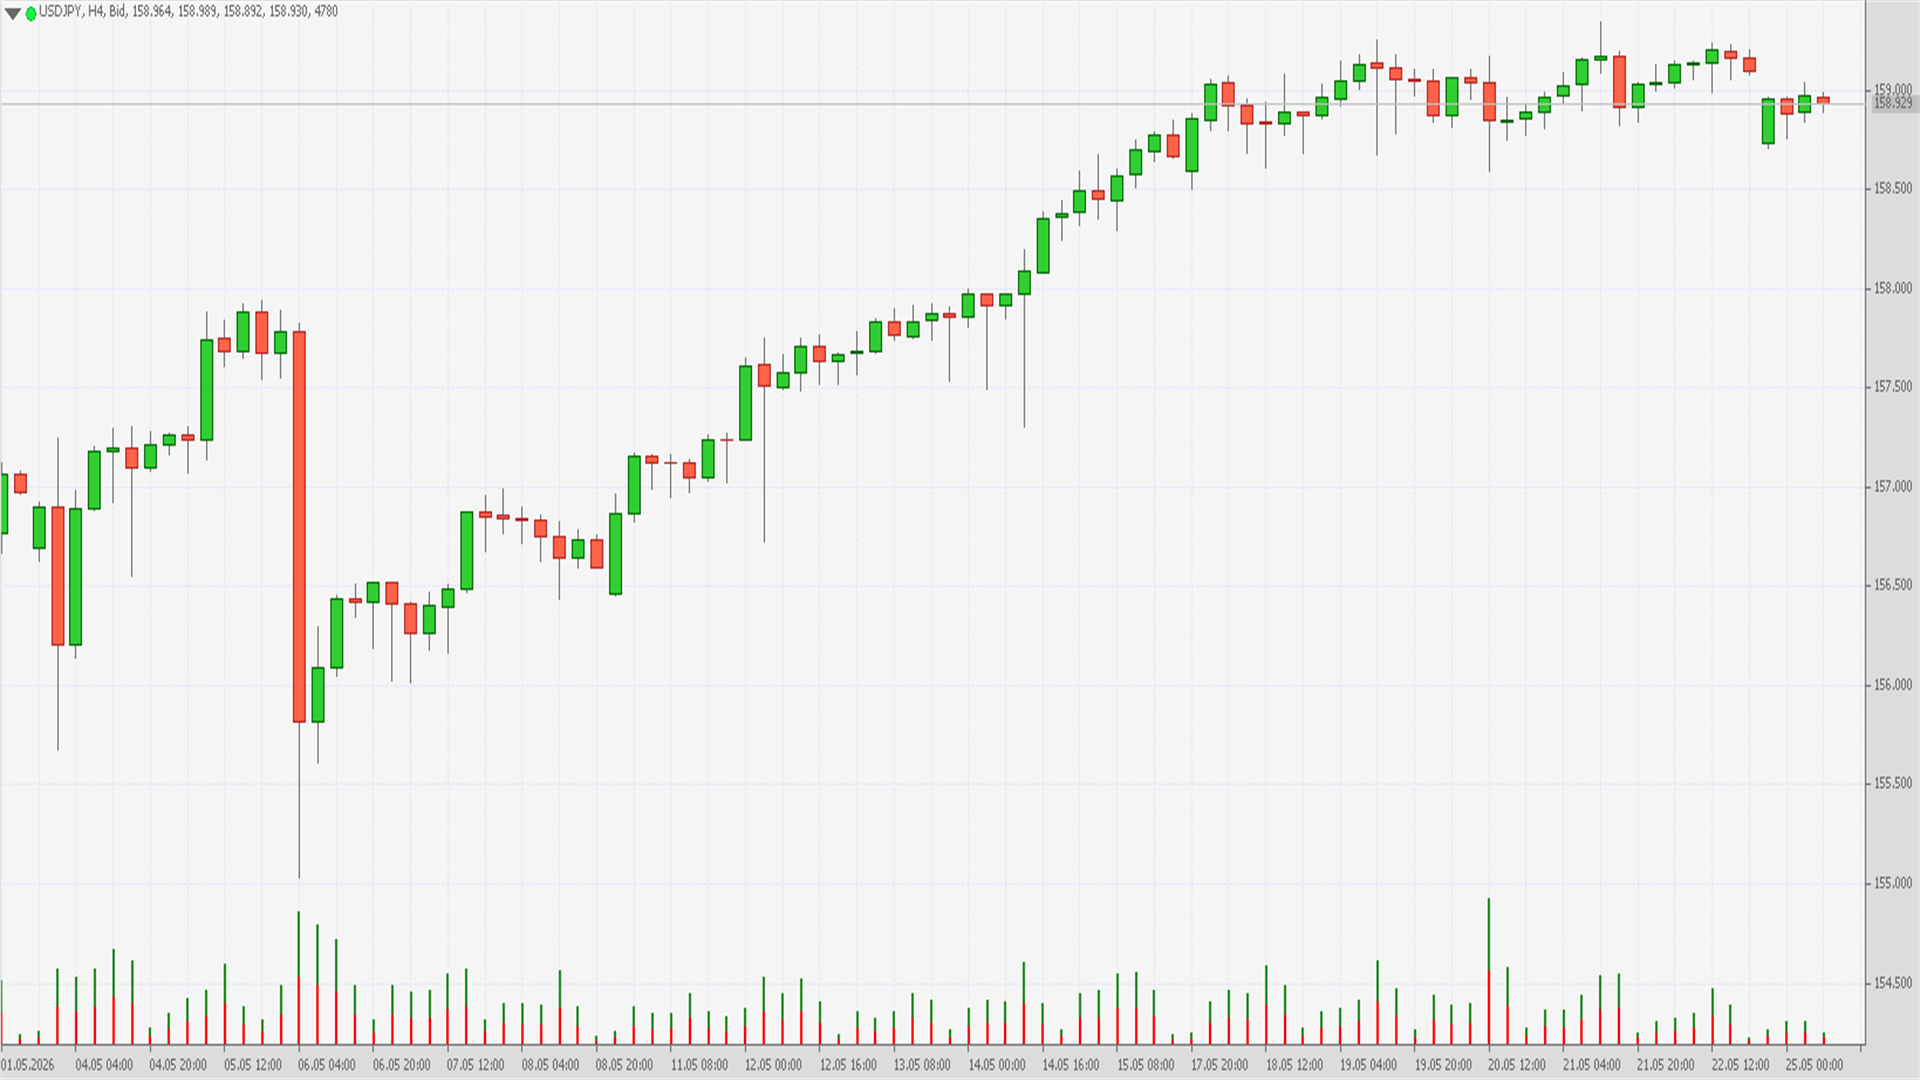
 
USDJPY Technical Analysis – 12 MAY, 2026
USDJPY - On 12 May 2026, the US Dollar against the Japanese Yen (USDJPY) reached a significant high at 157.76

vo2SafAx_o.png


Technical Analysis: USDJPY – High 157.76 (12 May 2026)

On 12 May 2026, the US Dollar against the Japanese Yen (USDJPY) reached a significant high at 157.76. This level is crucial because it reflects the ongoing strength of the US Dollar amid a hawkish Federal Reserve stance and highlights the Yen’s structural weakness under the Bank of Japan’s ultra loose monetary policy. The move underscores both technical and fundamental dynamics that have shaped the pair’s trajectory in recent months.

The broader context leading into May 2026 was dominated by US Dollar resilience. The Federal Reserve maintained elevated interest rates to combat inflation, reinforcing demand for the USD. In contrast, the Bank of Japan continued its yield curve control and negative interest rate policies, keeping the Yen under pressure. This divergence in monetary policy created a structural bias toward Dollar appreciation, pushing USDJPY higher into the 157.70 region. Episodes of global risk aversion occasionally lent support to the Yen, but these were insufficient to offset the broader trend.

From a technical perspective, the 157.76 high coincides with the upper boundary of a medium term ascending channel that has guided price action since late 2025. This channel reflects a series of higher highs and higher lows, confirming the bullish bias. The 157.70–157.80 zone has historically acted as a strong resistance cluster, and its retest suggests that market participants are reassessing whether this level will cap further gains or give way to a breakout. Should the pair break decisively above 157.80, the next logical resistance lies near 160.00, a psychologically important threshold and a level derived from prior swing highs and Fibonacci extension calculations.
Support levels are equally well defined. The immediate floor is at 155.50, coinciding with the 50 day moving average. A sustained break below this level would signal a potential corrective pullback, opening the path toward 153.00, where the 200 day moving average converges with prior swing lows. This zone represents a formidable cushion, and only a decisive breach would alter the medium term bullish outlook.

Momentum indicators provide further clarity. The Relative Strength Index (RSI) hovered near 68 at the time of the high, indicating that the pair was firmly in overbought territory. This positioning suggests potential for a short term consolidation or pullback. The Moving Average Convergence Divergence (MACD) histogram displayed widening positive bars, signalling that bullish momentum remained strong. However, any narrowing of these bars would hint at waning momentum. Volume analysis also showed heightened activity around 157.76, implying that institutional investors were actively engaging at this level, possibly taking profits or positioning for a breakout.

Macro drivers remain central to the outlook. The Yen’s performance is tied to the Bank of Japan’s policy trajectory and its safe haven role. Any escalation in geopolitical tensions or global risk aversion could bolster the Yen, at least temporarily. The US Dollar, however, continues to benefit from safe haven flows and higher yields, particularly during periods of global uncertainty. Geopolitical tensions, equity market volatility, or shifts in risk sentiment tend to favour the Dollar, reinforcing its defensive role. As such, USDJPY’s direction will depend heavily on the balance between BOJ’s accommodative stance and Federal Reserve hawkishness.

In conclusion, the high at 157.76 marks a pivotal point for USDJPY. If sellers cap this level, a pullback toward 155.50–153.00 is plausible, supported by overbought momentum signals. However, a sustained break above 157.80 would expose the pair to further upside risks, potentially toward 160.00 or higher. The interplay between BOJ policy and Federal Reserve strength will determine whether this level becomes a durable resistance or a stepping stone to further gains.

#fxopen #forex #forexanalysis

Disclaimer: This analysis represents my own opinion only. It is not to be construed as an opinion, offer, solicitation, recommendation, or financial advice of the Companies operating under the FXOpen brand.

For in-depth analysis, please check ...
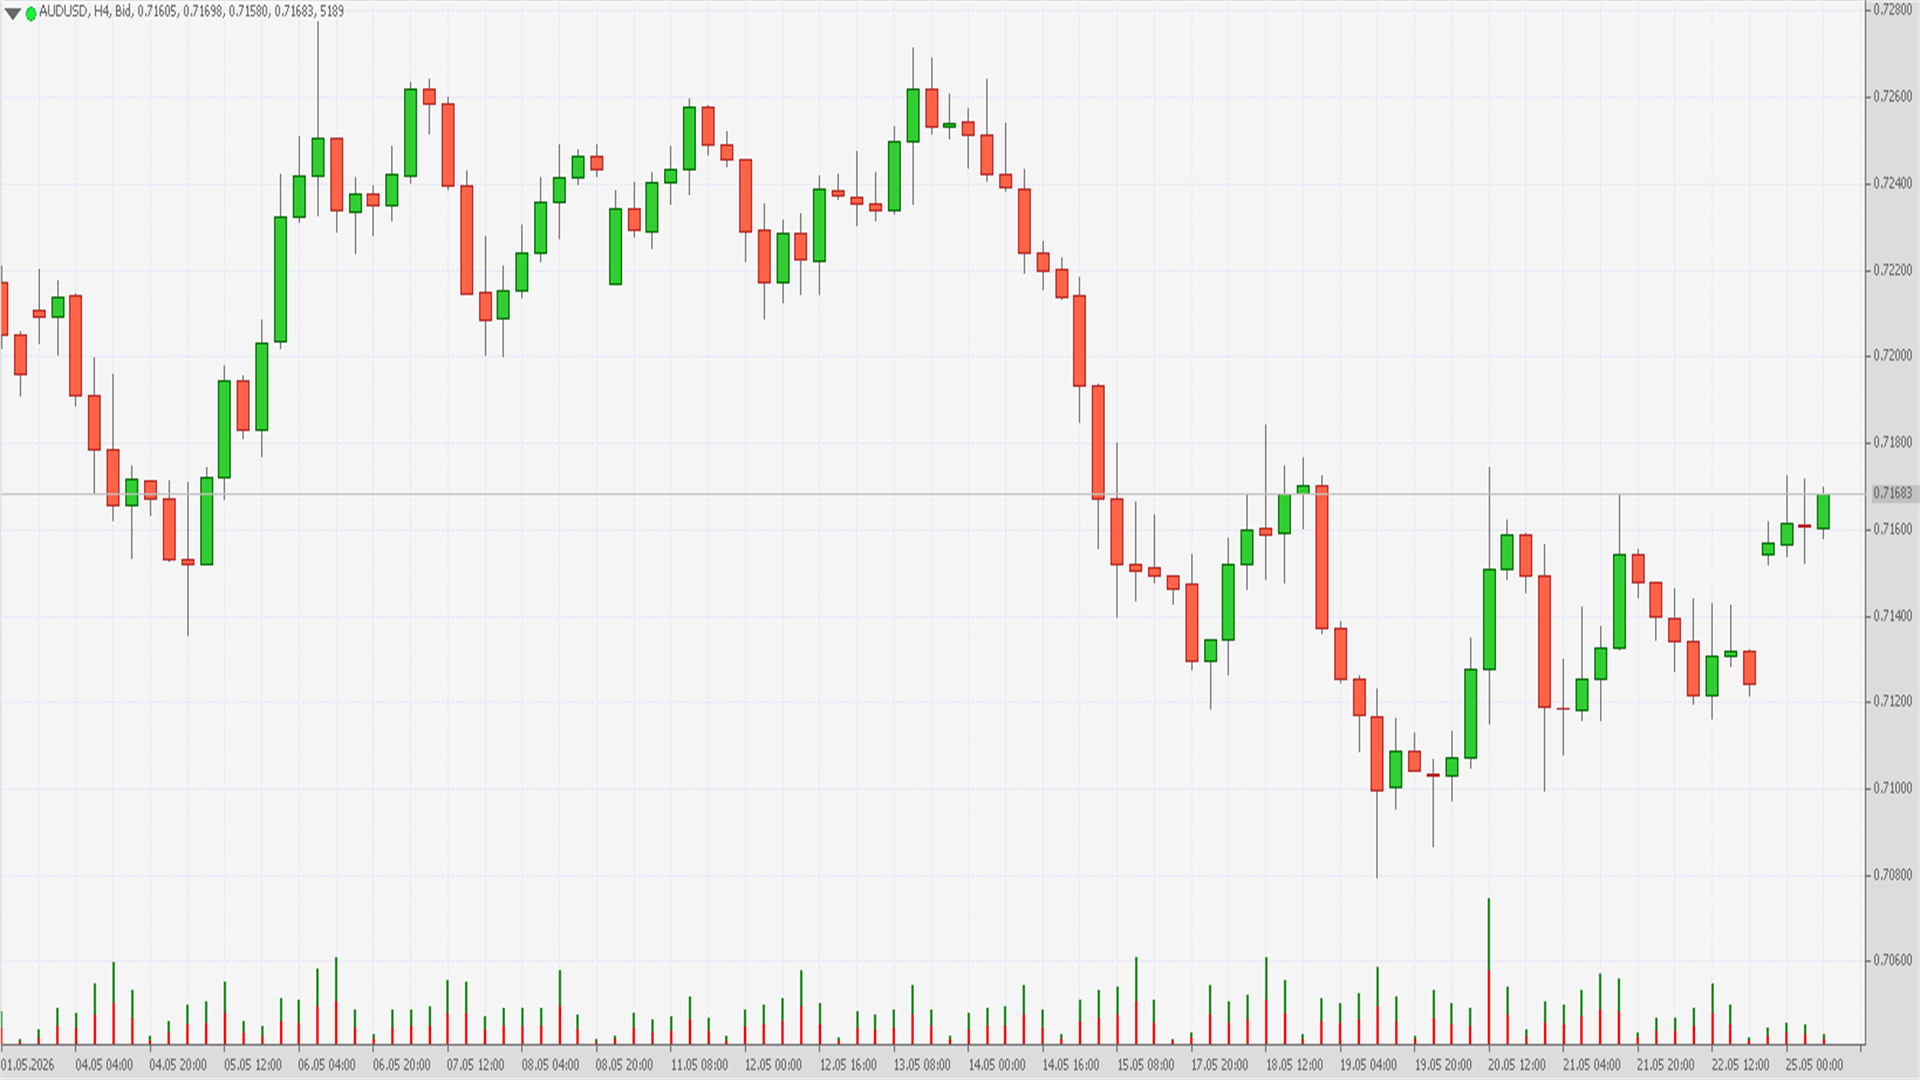
 
AUDUSD Technical Analysis – 13 MAY, 2026
AUDUSD – On 13 May 2026, the Australian Dollar against the US Dollar (AUDUSD) recorded a significant high at 0.7271

0AaQiGmJ_o.png


Technical Analysis: AUDUSD – High 0.7271 (13 May 2026)

On 13 May 2026, the Australian Dollar against the US Dollar (AUDUSD) recorded a significant high at 0.7271. This level is important because it reflects a corrective rebound in the pair following its recent weakness and highlights the interplay between commodity linked resilience in the Australian Dollar and the persistent strength of the US Dollar under a hawkish Federal Reserve. The move underscores both technical and fundamental dynamics that have shaped the pair’s trajectory in recent sessions.

The broader context leading into May 2026 was dominated by US Dollar strength. The Federal Reserve maintained elevated interest rates to combat inflation, reinforcing demand for the USD. In contrast, the Reserve Bank of Australia (RBA) adopted a more balanced stance, attempting to support growth while keeping inflation under control. Commodity prices, particularly iron ore and coal, showed signs of stabilization, providing some support to the Australian Dollar. This divergence in fundamentals created a structural bias toward Dollar appreciation, but the rebound to 0.7271 suggests that AUD buyers were attempting to regain ground.

From a technical perspective, the 0.7271 high coincides with the upper boundary of a short term corrective rally within a broader descending channel that has guided price action since late 2025. This channel reflects a series of lower highs and lower lows, confirming the bearish bias. The 0.7270–0.7280 zone has historically acted as a resistance cluster, and its retest suggests that market participants are reassessing whether this level will cap further gains or give way to a breakout. Should the pair break decisively above 0.7280, the next logical resistance lies near 0.7350, derived from prior swing highs and Fibonacci extension levels. A deeper extension could expose the psychologically important 0.7500 threshold.

Support levels are equally well defined. The immediate floor is at 0.7200, coinciding with the 50 day moving average. A sustained break below this level would signal a potential corrective pullback, opening the path toward 0.7150, where prior swing lows converge with Fibonacci retracement levels. This zone represents a formidable cushion, and only a decisive breach would alter the medium term outlook.

Momentum indicators provide further clarity. The Relative Strength Index (RSI) hovered near 58 at the time of the high, indicating that the pair was approaching overbought territory but still within neutral bounds. This positioning suggests potential for continued upside, though caution is warranted. The Moving Average Convergence Divergence (MACD) histogram displayed widening positive bars, signalling that bullish momentum was strengthening. Volume analysis also showed heightened activity around 0.7271, implying that institutional investors were actively engaging at this level, possibly positioning for a breakout.

Macro drivers remain central to the outlook. The Australian Dollar’s performance is tied to the RBA’s policy trajectory and the broader health of the commodity sector. Any rebound in iron ore and coal prices could provide tailwinds for the currency. The US Dollar, however, continues to benefit from safe haven flows and higher yields, particularly during periods of global uncertainty. Geopolitical tensions, equity market volatility, or shifts in risk sentiment tend to favour the Dollar, reinforcing its defensive role. As such, AUDUSD’s direction will depend heavily on the balance between Australia’s commodity resilience and US monetary policy strength.

In conclusion, the high at 0.7271 marks a pivotal point for AUDUSD. If buyers sustain momentum above this level, a move toward 0.7350–0.7500 is plausible, supported by improving momentum signals. However, a failure to break above 0.7280 would expose the pair to renewed downside risks, potentially toward 0.7200 or 0.7150. The interplay between RBA caution and Federal Reserve hawkishness will determine whether this level becomes a durable resistance or a stepping stone to further gains.

#fxopen #forex #forexanalysis

Disclaimer: This analysis represents my own opinion only. It is not to be construed as an opinion, offer, solicitation, recommendation, or financial advice of the Companies operating under the FXOpen brand.

For in-depth analysis, please check ...
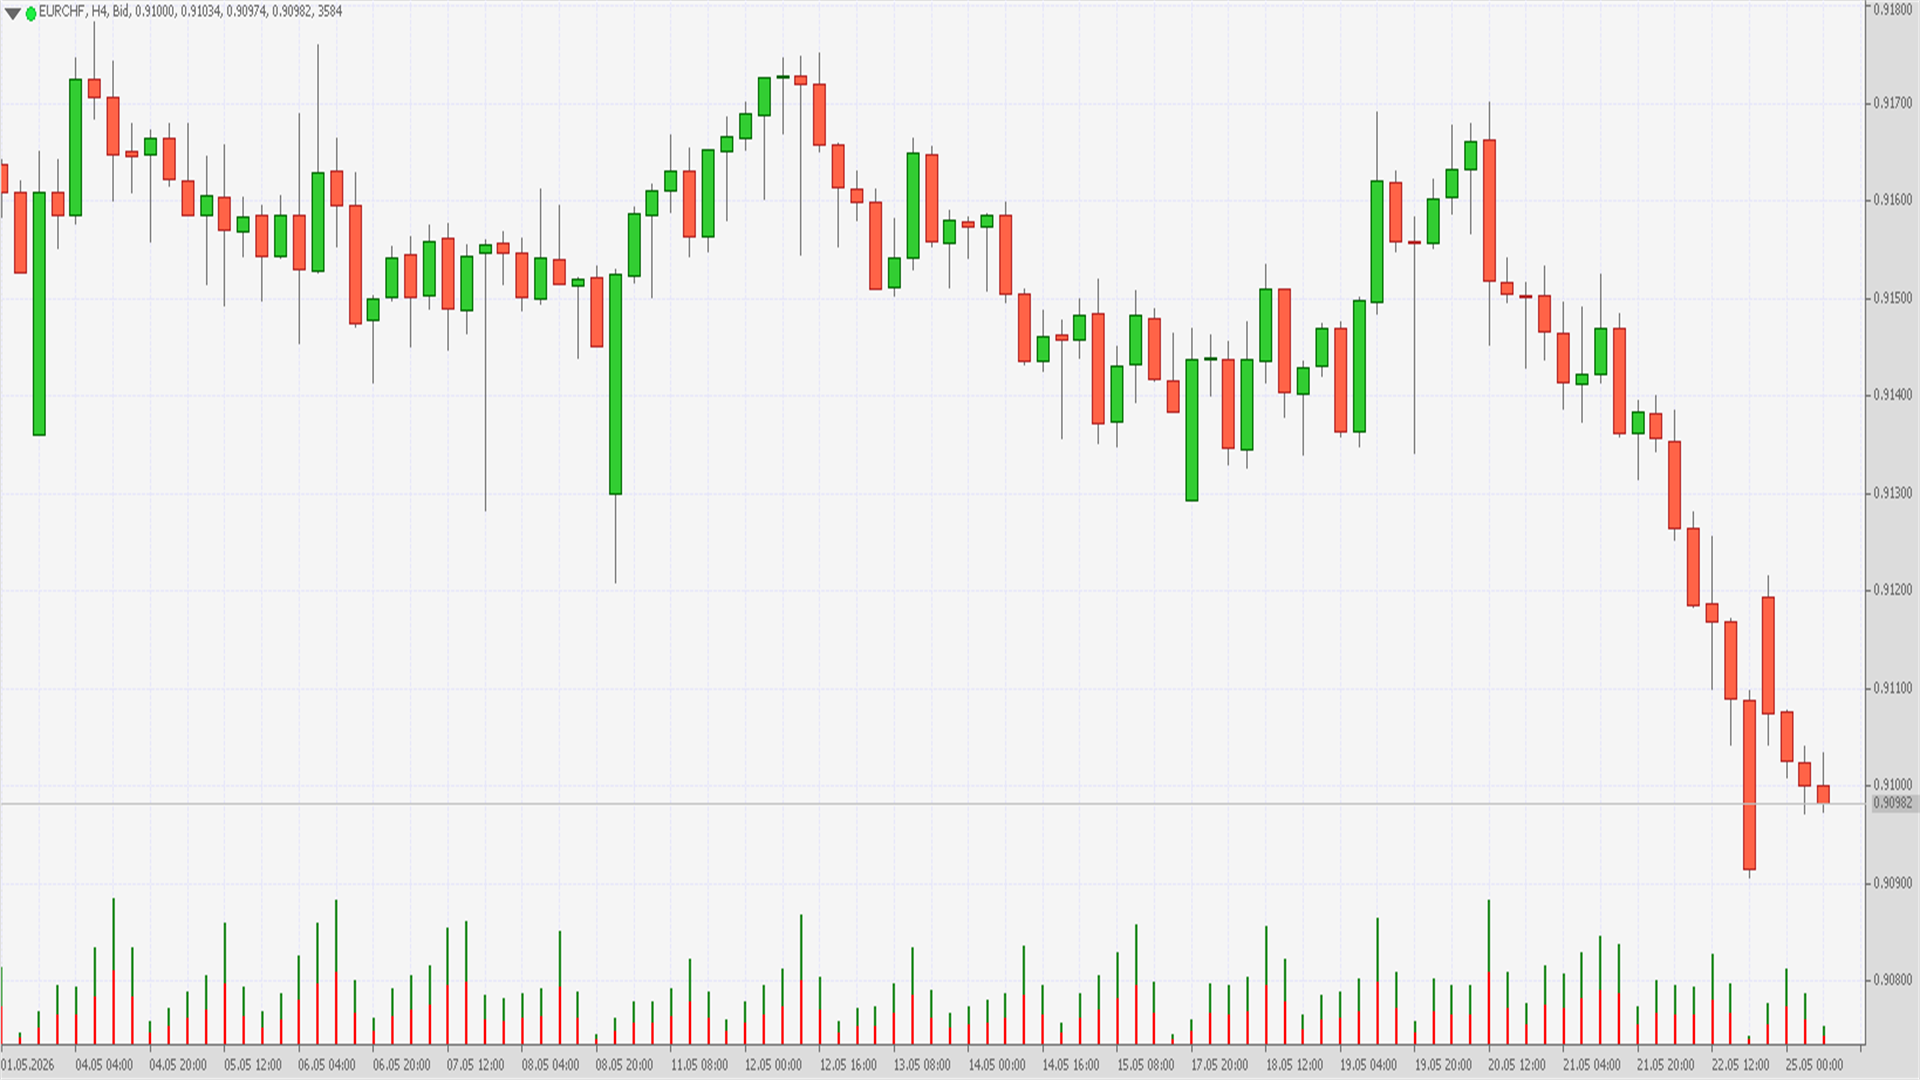
 
EURCHF Technical Analysis – 13 MAY, 2026
EURCHF – On 13 May 2026, the Euro against the Swiss Franc (EURCHF) recorded a notable high at 0.9166

wFrcxkny_o.png


Technical Analysis: EURCHF – High 0.9166 (13 May 2026)

On 13 May 2026, the Euro against the Swiss Franc (EURCHF) recorded a notable high at 0.9166. This level is significant because it reflects a corrective rebound in the pair following recent weakness and highlights the interplay between Eurozone fundamentals and the Swiss Franc’s safe haven appeal. The move underscores both technical and fundamental dynamics that have shaped the pair’s trajectory in recent sessions.

The broader context leading into May 2026 was one of cautious optimism in the Eurozone. The European Central Bank (ECB) maintained a balanced stance, attempting to support growth while keeping inflation under control. Meanwhile, the Swiss National Bank (SNB) continued to emphasize stability, but its relatively accommodative policy limited the Franc’s ability to appreciate. Global investors, while still viewing the Franc as a safe haven asset, favoured the Euro in periods of risk on sentiment, contributing to EURCHF’s rebound toward the 0.9166 level.

From a technical perspective, the 0.9166 high coincides with the upper boundary of a short term corrective rally within a broader consolidation range that has guided price action since late 2025. This range reflects repeated tests of support near 0.9150 and resistance near 0.9170, suggesting indecision among market participants. The retest of 0.9166 indicates that buyers were attempting to push the pair higher, but the level also represents a critical resistance zone. A decisive break above 0.9170 would expose the pair to further upside risks, with the next resistance near 0.9220, derived from prior swing highs and Fibonacci extension levels. Conversely, failure to break above 0.9166 would reinforce the consolidation pattern, keeping the pair range bound.

Support levels are equally well defined. The immediate floor is at 0.9120, coinciding with the 50 day moving average. A sustained break below this level would signal a potential corrective pullback, opening the path toward 0.9050, where the 200 day moving average converges with prior swing lows. This zone represents a formidable cushion, and only a decisive breach would alter the medium term outlook.

Momentum indicators provide further clarity. The Relative Strength Index (RSI) hovered near 57 at the time of the high, indicating that the pair was approaching overbought territory but still within neutral bounds. This positioning suggests potential for continued upside, though caution is warranted. The Moving Average Convergence Divergence (MACD) histogram displayed widening positive bars, signalling that bullish momentum was strengthening. Volume analysis also showed heightened activity around 0.9166, implying that institutional investors were actively engaging at this level, possibly positioning for a breakout.

Macro drivers remain central to the outlook. The Euro’s performance is tied to the ECB’s policy trajectory and the broader health of the Eurozone economy. Any signs of stronger growth or inflationary pressures could support the currency. The Swiss Franc, however, continues to benefit from safe haven flows, particularly during periods of global uncertainty. Geopolitical tensions, equity market volatility, or shifts in risk sentiment tend to favour the Franc, reinforcing its defensive role. As such, EURCHF’s direction will depend heavily on the balance between Eurozone recovery prospects and SNB caution.

In conclusion, the high at 0.9166 marks a pivotal point for EURCHF. If buyers sustain momentum above this level, a move toward 0.9220 is plausible, supported by improving momentum signals. However, a failure to break above 0.9170 would expose the pair to renewed downside risks, potentially toward 0.9120 or 0.9050. The interplay between ECB policy and SNB’s safe haven credibility will determine whether this level becomes a durable resistance or a stepping stone to further gains.

#fxopen #forex #forexanalysis

Disclaimer: This analysis represents my own opinion only. It is not to be construed as an opinion, offer, solicitation, recommendation, or financial advice of the Companies operating under the FXOpen brand.

For in-depth analysis, please check ...
 
EURJPY Technical Analysis – 13 MAY, 2026
EURJPY – On 13 May 2026, the Euro against the Japanese Yen (EURJPY) registered a significant low at 184.55

PGdo2z1J_o.png


Technical Analysis: EURJPY – Low 184.55 (13 May 2026)

On 13 May 2026, the Euro against the Japanese Yen (EURJPY) registered a significant low at 184.55. This level is notable because it reflects the broader volatility in global markets and the interplay between Eurozone fundamentals and the Yen’s dual role as both a funding currency and a safe haven asset. The move underscores both technical and fundamental dynamics that have shaped the pair’s trajectory in recent sessions.

The broader context leading into May 2026 was one of uncertainty. The European Central Bank (ECB) maintained a cautious stance, balancing inflationary concerns with fragile growth across the Eurozone. Meanwhile, the Bank of Japan (BOJ) continued its ultra loose monetary policy, including yield curve control and negative interest rates, which structurally weakened the Yen. However, during episodes of risk aversion, the Yen tends to strengthen as investors unwind carry trades, contributing to EURJPY’s decline toward the 184.55 level.

From a technical perspective, the 184.55 low coincides with the lower boundary of a medium term consolidation range that has guided price action since late 2025. This range reflects repeated tests of support near 184.50, suggesting that the level has become a critical pivot point. A decisive break below 184.50 would expose the pair to deeper downside risks, with the next support near 182.80, derived from prior swing lows and Fibonacci retracement levels. Conversely, if buyers defend 184.55, the pair could rebound toward resistance at 186.50 and 188.00, where moving averages and prior highs converge.

Momentum indicators provide further clarity. The Relative Strength Index (RSI) hovered near 41 at the time of the low, indicating that the pair was approaching oversold conditions but not yet at extremes. This positioning suggests potential for a corrective bounce. The Moving Average Convergence Divergence (MACD) histogram displayed narrowing negative bars, signalling that bearish momentum was losing intensity. A bullish crossover in the MACD would reinforce the case for recovery. Volume analysis also showed heightened activity around 184.55, implying that institutional investors were actively engaging at this level, possibly accumulating positions in anticipation of stabilization.
Macro drivers remain central to the outlook. The Euro’s trajectory depends on the ECB’s ability to balance inflation control with growth support. Any signs of stronger Eurozone recovery could bolster the currency. The Yen, however, remains heavily influenced by global risk sentiment. During risk off episodes, the Yen tends to strengthen as investors unwind carry trades, while in risk on environments, it weakens as capital flows into higher yielding assets. This dual role makes EURJPY particularly sensitive to shifts in global equity markets and geopolitical developments.

In conclusion, the low at 184.55 marks a pivotal point for EURJPY. If buyers defend this level, a rebound toward 186.50–188.00 is plausible, supported by improving momentum signals. However, a sustained break below 184.50 would expose the pair to deeper downside risks, potentially toward 182.80 or lower. The interplay between Eurozone fundamentals and the Yen’s safe haven dynamics will determine whether this level becomes a durable support or a stepping stone to further declines.

#fxopen #forex #forexanalysis

Disclaimer: This analysis represents my own opinion only. It is not to be construed as an opinion, offer, solicitation, recommendation, or financial advice of the Companies operating under the FXOpen brand.

For in-depth analysis, please check ...
 
EURUSD Technical Analysis – 13 MAY, 2026
EURUSD – On 13 May 2026, the Euro against the US Dollar (EURUSD) registered a significant low at 1.1695

gwGJfR5f_o.png


Technical Analysis: EURUSD – Low 1.1695 (13 May 2026)

On 13 May 2026, the Euro against the US Dollar (EURUSD) registered a significant low at 1.1695. This level is critical because it reflects the ongoing dominance of the US Dollar amid a hawkish Federal Reserve stance and highlights the Euro’s vulnerability in the face of uneven growth across the Eurozone. The move underscores both technical and fundamental dynamics that have shaped the pair’s trajectory in recent sessions.

The broader context leading into May 2026 was dominated by persistent US Dollar strength. The Federal Reserve maintained elevated interest rates to combat inflation, reinforcing demand for the USD. In contrast, the European Central Bank (ECB) adopted a cautious approach, balancing inflationary concerns with fragile growth across member states. This divergence in monetary policy created a structural bias toward Dollar appreciation, pushing EURUSD lower into the 1.1690 region. Risk off sentiment in global markets further amplified demand for the Dollar, adding pressure on the Euro.

From a technical perspective, the 1.1695 low coincides with the lower boundary of a descending channel that has guided price action since late 2025. This channel reflects a series of lower highs and lower lows, confirming the bearish bias. The 1.1690–1.1700 zone has historically acted as a strong support cluster, and its retest suggests that market participants are reassessing whether this level will hold as a durable base or give way to further declines. Should the pair break decisively below 1.1690, the next logical support lies near 1.1620, derived from prior swing lows and Fibonacci retracement levels. A deeper extension could expose the psychologically important 1.1500 threshold.
Resistance levels are equally well defined. The immediate ceiling is at 1.1780, coinciding with the 50 day moving average. A sustained break above this level would signal a potential corrective rebound, opening the path toward 1.1900, where the 200 day moving average converges with prior swing highs. This zone represents a formidable barrier, and only a decisive breach would alter the medium term bearish outlook.

Momentum indicators provide further clarity. The Relative Strength Index (RSI) hovered near 35 at the time of the low, indicating that the pair was approaching oversold territory. This positioning suggests potential for a corrective bounce. The Moving Average Convergence Divergence (MACD) histogram displayed narrowing negative bars, signalling that bearish momentum was losing intensity. A bullish crossover in the MACD would reinforce the case for recovery. Volume analysis also showed heightened activity around 1.1695, implying that institutional investors were actively engaging at this level, possibly accumulating positions in anticipation of stabilization.

Macro drivers remain central to the outlook. The Euro’s performance is tied to the ECB’s policy trajectory and the broader health of the Eurozone economy. Any signs of stronger growth or inflationary pressures could support the currency. The US Dollar, however, continues to benefit from safe haven flows and higher yields, particularly during periods of global uncertainty. Geopolitical tensions, equity market volatility, or shifts in risk sentiment tend to favour the Dollar, reinforcing its defensive role. As such, EURUSD’s direction will depend heavily on the balance between Eurozone recovery prospects and US monetary policy strength.

In conclusion, the low at 1.1695 marks a pivotal point for EURUSD. If buyers defend this level, a rebound toward 1.1780–1.1900 is plausible, supported by improving momentum signals. However, a sustained break below 1.1690 would expose the pair to deeper downside risks, potentially toward 1.1620 or even 1.1500. The interplay between ECB caution and Federal Reserve hawkishness will determine whether this level becomes a durable support or a stepping stone to further declines.

#fxopen #forex #forexanalysis

Disclaimer: This analysis represents my own opinion only. It is not to be construed as an opinion, offer, solicitation, recommendation, or financial advice of the Companies operating under the FXOpen brand.

For in-depth analysis, please check ...
 
GBPJPY Technical Analysis – 13 MAY, 2026
GBPJPY – On 13 May 2026, the British Pound against the Japanese Yen (GBPJPY) registered a significant low at 212.83

yNabYuCE_o.png


Technical Analysis: GBPJPY – Low 212.83 (13 May 2026)

On 13 May 2026, the British Pound against the Japanese Yen (GBPJPY) registered a significant low at 212.83. This level is notable because it reflects the interplay between the Bank of England’s policy stance and the Yen’s dual role as both a funding currency and a safe haven asset. The move underscores both technical and fundamental dynamics that have shaped the pair’s trajectory in recent sessions.

The broader context leading into May 2026 was one of volatility in GBPJPY. The Bank of England maintained relatively high interest rates to combat persistent inflationary pressures in the UK, but concerns about slowing growth and political uncertainty weighed on the Pound. The Japanese Yen, meanwhile, continued to trade under structural weakness due to the Bank of Japan’s ultra loose monetary policy, but it strengthened during episodes of risk aversion as investors unwound carry trades. This dynamic contributed to GBPJPY’s decline toward the 212.83 level.

From a technical perspective, the 212.83 low coincides with the lower boundary of a medium term ascending channel that has guided price action since mid 2025. This channel reflects a series of higher highs and higher lows, confirming the broader bullish bias in GBPJPY. The retest of 212.83 suggests that this level is acting as a critical support zone. A decisive break below 212.80 would expose the pair to deeper downside risks, with the next support near 210.50, derived from prior swing lows and Fibonacci retracement levels. Conversely, if buyers defend 212.83, the pair could rebound toward resistance at 215.50 and 218.00, where moving averages and prior highs converge.
Momentum indicators provide further clarity. The Relative Strength Index (RSI) hovered near 40 at the time of the low, indicating that the pair was approaching oversold conditions but not yet at extremes.

This positioning suggests potential for a corrective bounce. The Moving Average Convergence Divergence (MACD) histogram displayed narrowing negative bars, signalling that bearish momentum was losing intensity. A bullish crossover in the MACD would reinforce the case for recovery. Volume analysis also showed heightened activity around 212.83, implying that institutional investors were actively engaging at this level, possibly accumulating positions in anticipation of stabilization.

Macro drivers remain central to the outlook. The Pound’s trajectory depends on the Bank of England’s ability to balance inflation control with growth support. Any signs of stronger UK economic resilience could bolster the currency. The Yen, however, remains heavily influenced by global risk sentiment. During risk off episodes, the Yen tends to strengthen as investors unwind carry trades, while in risk on environments, it weakens as capital flows into higher yielding assets. This dual role makes GBPJPY particularly sensitive to shifts in global equity markets and geopolitical developments.

In conclusion, the low at 212.83 marks a pivotal point for GBPJPY. If buyers defend this level, a rebound toward 215.50–218.00 is plausible, supported by improving momentum signals. However, a sustained break below 212.80 would expose the pair to deeper downside risks, potentially toward 210.50 or lower. The interplay between Bank of England policy and the Yen’s safe haven dynamics will determine whether this level becomes a durable support or a stepping stone to further declines.

#fxopen #forex #forexanalysis

Disclaimer: This analysis represents my own opinion only. It is not to be construed as an opinion, offer, solicitation, recommendation, or financial advice of the Companies operating under the FXOpen brand.

For in-depth analysis, please check ...
 
GBPUSD Technical Analysis – 13 MAY, 2026
GBPUSD – On 13 May 2026, the British Pound against the US Dollar (GBPUSD) registered a significant low at 1.3484

spval9Zm_o.png


Technical Analysis: GBPUSD – Low 1.3484 (13 May 2026)

On 13 May 2026, the British Pound against the US Dollar (GBPUSD) registered a significant low at 1.3484. This level is critical because it reflects the ongoing dominance of the US Dollar amid a hawkish Federal Reserve stance and highlights the Pound’s vulnerability in the face of domestic economic challenges and political uncertainty. The move underscores both technical and fundamental dynamics that have shaped the pair’s trajectory in recent sessions.
The broader context leading into May 2026 was dominated by persistent US Dollar strength. The Federal Reserve maintained elevated interest rates to combat inflation, reinforcing demand for the USD. In contrast, the Bank of England faced a difficult balancing act. While inflationary pressures remained elevated, growth indicators in the UK showed signs of weakness, limiting the central bank’s ability to tighten policy further. Political uncertainty surrounding fiscal policy and trade negotiations added to the Pound’s fragility. This divergence in fundamentals created a structural bias toward Dollar appreciation, pushing GBPUSD lower into the 1.3480 region.

From a technical perspective, the 1.3484 low coincides with the lower boundary of a descending channel that has guided price action since late 2025. This channel reflects a series of lower highs and lower lows, confirming the bearish bias. The 1.3480–1.3490 zone has historically acted as a strong support cluster, and its retest suggests that market participants are reassessing whether this level will hold as a durable base or give way to further declines. Should the pair break decisively below 1.3480, the next logical support lies near 1.3400, derived from prior swing lows and Fibonacci retracement levels. A deeper extension could expose the psychologically important 1.3200 threshold.
Resistance levels are equally well defined. The immediate ceiling is at 1.3580, coinciding with the 50 day moving average. A sustained break above this level would signal a potential corrective rebound, opening the path toward 1.3720, where the 200 day moving average converges with prior swing highs. This zone represents a formidable barrier, and only a decisive breach would alter the medium term bearish outlook.

Momentum indicators provide further clarity. The Relative Strength Index (RSI) hovered near 36 at the time of the low, indicating that the pair was approaching oversold territory. This positioning suggests potential for a corrective bounce. The Moving Average Convergence Divergence (MACD) histogram displayed narrowing negative bars, signalling that bearish momentum was losing intensity. A bullish crossover in the MACD would reinforce the case for recovery. Volume analysis also showed heightened activity around 1.3484, implying that institutional investors were actively engaging at this level, possibly accumulating positions in anticipation of stabilization.

Macro drivers remain central to the outlook. The Pound’s performance is tied to the Bank of England’s policy trajectory and the broader health of the UK economy. Any signs of stronger growth or inflationary pressures could support the currency. The US Dollar, however, continues to benefit from safe haven flows and higher yields, particularly during periods of global uncertainty. Geopolitical tensions, equity market volatility, or shifts in risk sentiment tend to favour the Dollar, reinforcing its defensive role. As such, GBPUSD’s direction will depend heavily on the balance between UK recovery prospects and US monetary policy strength.

In conclusion, the low at 1.3484 marks a pivotal point for GBPUSD. If buyers defend this level, a rebound toward 1.3580–1.3720 is plausible, supported by improving momentum signals. However, a sustained break below 1.3480 would expose the pair to deeper downside risks, potentially toward 1.3400 or even 1.3200. The interplay between Bank of England caution and Federal Reserve hawkishness will determine whether this level becomes a durable support or a stepping stone to further declines.

#fxopen #forex #forexanalysis

Disclaimer: This analysis represents my own opinion only. It is not to be construed as an opinion, offer, solicitation, recommendation, or financial advice of the Companies operating under the FXOpen brand.

For in-depth analysis, please check ...
 
NZDUSD Technical Analysis – 13 MAY, 2026
NZDUSD – On 13 May 2026, the New Zealand Dollar against the US Dollar (NZDUSD) registered a significant low at 0.5919

spDGTqOI_o.png


Technical Analysis: NZDUSD – Low 0.5919 (13 May 2026)

On 13 May 2026, the New Zealand Dollar against the US Dollar (NZDUSD) registered a significant low at 0.5919. This level is critical because it reflects the structural weakness of the New Zealand Dollar amid subdued domestic growth and the persistent strength of the US Dollar under a hawkish Federal Reserve. The move underscores both technical and fundamental dynamics that have shaped the pair’s trajectory in recent sessions.

The broader context leading into May 2026 was dominated by US Dollar resilience. The Federal Reserve’s commitment to elevated interest rates kept yields attractive, reinforcing demand for the USD. In contrast, the Reserve Bank of New Zealand (RBNZ) faced challenges in balancing inflationary pressures with slowing growth. Agricultural exports, which are central to New Zealand’s economy, had shown signs of weakness due to softer global demand, further undermining the NZD. This divergence in fundamentals created a structural bias toward Dollar appreciation, pushing NZDUSD lower into the 0.5920 region.

From a technical perspective, the 0.5919 low coincides with the lower boundary of a descending channel that has guided price action since late 2025. This channel reflects a series of lower highs and lower lows, confirming the bearish bias. The 0.5920 zone has historically acted as a strong support cluster, and its retest suggests that market participants are reassessing whether this level will hold as a durable base or give way to further declines. Should the pair break decisively below 0.5919, the next logical support lies near 0.5850, derived from prior swing lows and Fibonacci retracement levels. A deeper extension could expose the psychologically important 0.5700 threshold.
Resistance levels are equally well defined. The immediate ceiling is at 0.6000, coinciding with the 50 day moving average. A sustained break above this level would signal a potential corrective rebound, opening the path toward 0.6120, where the 200 day moving average converges with prior swing highs. This zone represents a formidable barrier, and only a decisive breach would alter the medium term bearish outlook.

Momentum indicators provide further clarity. The Relative Strength Index (RSI) hovered near 33 at the time of the low, indicating that the pair was firmly in oversold territory. This positioning suggests potential for a corrective bounce. The Moving Average Convergence Divergence (MACD) histogram displayed narrowing negative bars, signalling that bearish momentum was losing intensity. A bullish crossover in the MACD would reinforce the case for recovery. Volume analysis also showed heightened activity around 0.5919, implying that institutional investors were actively engaging at this level, possibly accumulating positions in anticipation of stabilization.

Macro drivers remain central to the outlook. The New Zealand Dollar’s performance is tied to the RBNZ’s policy trajectory and the broader health of the agricultural export sector. Any rebound in global demand for dairy and meat products could provide tailwinds for the currency. The US Dollar, however, continues to benefit from safe haven flows and higher yields, particularly during periods of global uncertainty. Geopolitical tensions, equity market volatility, or shifts in risk sentiment tend to favour the Dollar, reinforcing its defensive role. As such, NZDUSD’s direction will depend heavily on the balance between New Zealand’s export resilience and US monetary policy strength.

In conclusion, the low at 0.5919 marks a pivotal point for NZDUSD. If buyers defend this level, a rebound toward 0.6000–0.6120 is plausible, supported by improving momentum signals. However, a sustained break below 0.5919 would expose the pair to deeper downside risks, potentially toward 0.5850 or even 0.5700. The interplay between RBNZ caution and Federal Reserve hawkishness will determine whether this level becomes a durable support or a stepping stone to further declines.

#fxopen #forex #forexanalysis

Disclaimer: This analysis represents my own opinion only. It is not to be construed as an opinion, offer, solicitation, recommendation, or financial advice of the Companies operating under the FXOpen brand.

For in-depth analysis, please check ...
 
USDCAD Technical Analysis – 13 MAY, 2026
USDCAD – On 13 May 2026, the US Dollar against the Canadian Dollar (USDCAD) reached a significant high at 1.3718

2qClijEl_o.png


Technical Analysis: USDCAD – High 1.3718 (13 May 2026)

On 13 May 2026, the US Dollar against the Canadian Dollar (USDCAD) reached a significant high at 1.3718. This level is important because it reflects the persistent strength of the US Dollar amid a hawkish Federal Reserve stance and highlights the Canadian Dollar’s vulnerability in the face of softer commodity prices and domestic economic challenges. The move underscores both technical and fundamental dynamics that have shaped the pair’s trajectory in recent sessions.

The broader context leading into May 2026 was dominated by US Dollar resilience. The Federal Reserve maintained elevated interest rates to combat inflation, reinforcing demand for the USD. In contrast, the Bank of Canada faced a more delicate balancing act. While inflationary pressures remained present, growth indicators in Canada showed signs of weakness, limiting the central bank’s ability to tighten policy further. Additionally, crude oil prices, a key driver of the Canadian Dollar, had softened, undermining CAD’s support. This divergence in fundamentals created a structural bias toward Dollar appreciation, pushing USDCAD higher into the 1.3710–1.3720 region.

From a technical perspective, the 1.3718 high coincides with the upper boundary of a medium term ascending channel that has guided price action since late 2025. This channel reflects a series of higher highs and higher lows, confirming the bullish bias. The 1.3710–1.3720 zone has historically acted as a strong resistance cluster, and its retest suggests that market participants are reassessing whether this level will cap further gains or give way to a breakout. Should the pair break decisively above 1.3720, the next logical resistance lies near 1.3800, derived from prior swing highs and Fibonacci extension levels. A deeper extension could expose the psychologically important 1.4000 threshold.

Support levels are equally well defined. The immediate floor is at 1.3620, coinciding with the 50 day moving average. A sustained break below this level would signal a potential corrective pullback, opening the path toward 1.3500, where the 200 day moving average converges with prior swing lows. This zone represents a formidable cushion, and only a decisive breach would alter the medium term bullish outlook.

Momentum indicators provide further clarity. The Relative Strength Index (RSI) hovered near 63 at the time of the high, indicating that the pair was approaching overbought territory. This positioning suggests potential for a short term consolidation or pullback. The Moving Average Convergence Divergence (MACD) histogram displayed widening positive bars, signalling that bullish momentum remained strong. However, any narrowing of these bars would hint at waning momentum. Volume analysis also showed heightened activity around 1.3718, implying that institutional investors were actively engaging at this level, possibly taking profits or positioning for a breakout.

Macro drivers remain central to the outlook. The Canadian Dollar’s performance is tied to the Bank of Canada’s policy trajectory and the broader health of the energy sector. Any rebound in crude oil prices could provide tailwinds for CAD. The US Dollar, however, continues to benefit from safe haven flows and higher yields, particularly during periods of global uncertainty. Geopolitical tensions, equity market volatility, or shifts in risk sentiment tend to favour the Dollar, reinforcing its defensive role. As such, USDCAD’s direction will depend heavily on the balance between Canadian energy resilience and US monetary policy strength.

In conclusion, the high at 1.3718 marks a pivotal point for USDCAD. If sellers cap this level, a pullback toward 1.3620–1.3500 is plausible, supported by overbought momentum signals. However, a sustained break above 1.3720 would expose the pair to further upside risks, potentially toward 1.3800 or even 1.4000. The interplay between Bank of Canada caution and Federal Reserve hawkishness will determine whether this level becomes a durable resistance or a stepping stone to further gains.

#fxopen #forex #forexanalysis

Disclaimer: This analysis represents my own opinion only. It is not to be construed as an opinion, offer, solicitation, recommendation, or financial advice of the Companies operating under the FXOpen brand.

For in-depth analysis, please check ...
 
USDCHF Technical Analysis – 13 MAY, 2026
USDCHF – On 13 May 2026, the US Dollar against the Swiss Franc (USDCHF) reached a notable high at 0.7831

RAhGkPfT_o.png


Technical Analysis: USDCHF – High 0.7831 (13 May 2026)

On 13 May 2026, the US Dollar against the Swiss Franc (USDCHF) reached a notable high at 0.7831. This level is significant because it reflects the persistent strength of the US Dollar amid a hawkish Federal Reserve stance and highlights the Swiss Franc’s relative weakness despite its traditional safe haven appeal. The move underscores both technical and fundamental dynamics that have shaped the pair’s trajectory in recent sessions.

The broader context leading into May 2026 was dominated by US Dollar resilience. The Federal Reserve maintained elevated interest rates to combat inflation, reinforcing demand for the USD. In contrast, the Swiss National Bank (SNB) continued to emphasize stability, but its relatively accommodative stance limited the Franc’s ability to appreciate. Global investors, while still viewing the Franc as a safe haven asset, favoured the Dollar due to its higher yields and deeper liquidity. This divergence in fundamentals created a structural bias toward Dollar appreciation, pushing USDCHF higher into the 0.7830 region.

From a technical perspective, the 0.7831 high coincides with the upper boundary of a medium term ascending channel that has guided price action since late 2025. This channel reflects a series of higher highs and higher lows, confirming the bullish bias. The 0.7830 zone has historically acted as a strong resistance cluster, and its retest suggests that market participants are reassessing whether this level will cap further gains or give way to a breakout. Should the pair break decisively above 0.7830, the next logical resistance lies near 0.7900, derived from prior swing highs and Fibonacci extension levels. A deeper extension could expose the psychologically important 0.8000 threshold.

Support levels are equally well defined. The immediate floor is at 0.7730, coinciding with the 50 day moving average. A sustained break below this level would signal a potential corrective pullback, opening the path toward 0.7600, where the 200 day moving average converges with prior swing lows. This zone represents a formidable cushion, and only a decisive breach would alter the medium term bullish outlook.

Momentum indicators provide further clarity. The Relative Strength Index (RSI) hovered near 65 at the time of the high, indicating that the pair was firmly in overbought territory. This positioning suggests potential for a short term consolidation or pullback. The Moving Average Convergence Divergence (MACD) histogram displayed widening positive bars, signalling that bullish momentum remained strong. However, any narrowing of these bars would hint at waning momentum. Volume analysis also showed heightened activity around 0.7831, implying that institutional investors were actively engaging at this level, possibly taking profits or positioning for a breakout.

Macro drivers remain central to the outlook. The Swiss Franc’s performance is tied to the SNB’s policy trajectory and its safe haven role. Any escalation in geopolitical tensions or global risk aversion could bolster the Franc. The US Dollar, however, continues to benefit from safe haven flows and higher yields, particularly during periods of global uncertainty. Geopolitical tensions, equity market volatility, or shifts in risk sentiment tend to favour the Dollar, reinforcing its defensive role. As such, USDCHF’s direction will depend heavily on the balance between SNB caution and Federal Reserve hawkishness.

In conclusion, the high at 0.7831 marks a pivotal point for USDCHF. If sellers cap this level, a pullback toward 0.7730–0.7600 is plausible, supported by overbought momentum signals. However, a sustained break above 0.7830 would expose the pair to further upside risks, potentially toward 0.7900 or even 0.8000. The interplay between SNB policy and Federal Reserve strength will determine whether this level becomes a durable resistance or a stepping stone to further gains.

#fxopen #forex #forexanalysis

Disclaimer: This analysis represents my own opinion only. It is not to be construed as an opinion, offer, solicitation, recommendation, or financial advice of the Companies operating under the FXOpen brand.

For in-depth analysis, please check ...
 
USDJPY Technical Analysis – 13 MAY, 2026
USDJPY - On 13 May 2026, the US Dollar against the Japanese Yen (USDJPY) reached a significant high at 157.92

vo2SafAx_o.png


Technical Analysis: USDJPY – High 157.92 (13 May 2026)

On 13 May 2026, the US Dollar against the Japanese Yen (USDJPY) reached a significant high at 157.92. This level is crucial because it reflects the ongoing strength of the US Dollar amid a hawkish Federal Reserve stance and highlights the Yen’s structural weakness under the Bank of Japan’s ultra loose monetary policy. The move underscores both technical and fundamental dynamics that have shaped the pair’s trajectory in recent sessions.

The broader context leading into May 2026 was dominated by US Dollar resilience. The Federal Reserve maintained elevated interest rates to combat inflation, reinforcing demand for the USD. In contrast, the Bank of Japan continued its yield curve control and negative interest rate policies, keeping the Yen under pressure. This divergence in monetary policy created a structural bias toward Dollar appreciation, pushing USDJPY higher into the 157.90 region. Episodes of global risk aversion occasionally lent support to the Yen, but these were insufficient to offset the broader trend.

From a technical perspective, the 157.92 high coincides with the upper boundary of a medium term ascending channel that has guided price action since late 2025. This channel reflects a series of higher highs and higher lows, confirming the bullish bias. The 157.90–158.00 zone has historically acted as a strong resistance cluster, and its retest suggests that market participants are reassessing whether this level will cap further gains or give way to a breakout. Should the pair break decisively above 158.00, the next logical resistance lies near 160.00, a psychologically important threshold and a level derived from prior swing highs and Fibonacci extension calculations.
Support levels are equally well defined. The immediate floor is at 155.50, coinciding with the 50 day moving average. A sustained break below this level would signal a potential corrective pullback, opening the path toward 153.00, where the 200 day moving average converges with prior swing lows. This zone represents a formidable cushion, and only a decisive breach would alter the medium term bullish outlook.

Momentum indicators provide further clarity. The Relative Strength Index (RSI) hovered near 69 at the time of the high, indicating that the pair was firmly in overbought territory. This positioning suggests potential for a short term consolidation or pullback. The Moving Average Convergence Divergence (MACD) histogram displayed widening positive bars, signalling that bullish momentum remained strong. However, any narrowing of these bars would hint at waning momentum. Volume analysis also showed heightened activity around 157.92, implying that institutional investors were actively engaging at this level, possibly taking profits or positioning for a breakout.

Macro drivers remain central to the outlook. The Yen’s performance is tied to the Bank of Japan’s policy trajectory and its safe haven role. Any escalation in geopolitical tensions or global risk aversion could bolster the Yen, at least temporarily. The US Dollar, however, continues to benefit from safe haven flows and higher yields, particularly during periods of global uncertainty. Geopolitical tensions, equity market volatility, or shifts in risk sentiment tend to favour the Dollar, reinforcing its defensive role. As such, USDJPY’s direction will depend heavily on the balance between BOJ’s accommodative stance and Federal Reserve hawkishness.

In conclusion, the high at 157.92 marks a pivotal point for USDJPY. If sellers cap this level, a pullback toward 155.50–153.00 is plausible, supported by overbought momentum signals. However, a sustained break above 158.00 would expose the pair to further upside risks, potentially toward 160.00 or higher. The interplay between BOJ policy and Federal Reserve strength will determine whether this level becomes a durable resistance or a stepping stone to further gains.

#fxopen #forex #forexanalysis

Disclaimer: This analysis represents my own opinion only. It is not to be construed as an opinion, offer, solicitation, recommendation, or financial advice of the Companies operating under the FXOpen brand.

For in-depth analysis, please check ...
 
AUDUSD Technical Analysis – 14 MAY, 2026
AUDUSD – On 14 May 2026, the Australian Dollar against the US Dollar (AUDUSD) recorded a significant high at 0.7264

0AaQiGmJ_o.png


Technical Analysis: AUDUSD – High 0.7264 (14 May 2026)

On 14 May 2026, the Australian Dollar against the US Dollar (AUDUSD) recorded a significant high at 0.7264. This level is important because it reflects a corrective rebound in the pair following recent weakness and highlights the interplay between commodity linked resilience in the Australian Dollar and the persistent strength of the US Dollar under a hawkish Federal Reserve. The move underscores both technical and fundamental dynamics that have shaped the pair’s trajectory in recent sessions.

The broader context leading into mid May 2026 was dominated by US Dollar strength. The Federal Reserve maintained elevated interest rates to combat inflation, reinforcing demand for the USD. In contrast, the Reserve Bank of Australia (RBA) adopted a more balanced stance, attempting to support growth while keeping inflation under control. Commodity prices, particularly iron ore and coal, showed signs of stabilization, providing some support to the Australian Dollar. This divergence in fundamentals created a structural bias toward Dollar appreciation, but the rebound to 0.7264 suggests that AUD buyers were attempting to regain ground.

From a technical perspective, the 0.7264 high coincides with the upper boundary of a short term corrective rally within a broader descending channel that has guided price action since late 2025. This channel reflects a series of lower highs and lower lows, confirming the bearish bias. The 0.7260–0.7270 zone has historically acted as a resistance cluster, and its retest suggests that market participants are reassessing whether this level will cap further gains or give way to a breakout. Should the pair break decisively above 0.7270, the next logical resistance lies near 0.7350, derived from prior swing highs and Fibonacci extension levels. A deeper extension could expose the psychologically important 0.7500 threshold.

Support levels are equally well defined. The immediate floor is at 0.7200, coinciding with the 50 day moving average. A sustained break below this level would signal a potential corrective pullback, opening the path toward 0.7150, where prior swing lows converge with Fibonacci retracement levels. This zone represents a formidable cushion, and only a decisive breach would alter the medium term outlook.

Momentum indicators provide further clarity. The Relative Strength Index (RSI) hovered near 59 at the time of the high, indicating that the pair was approaching overbought territory but still within neutral bounds. This positioning suggests potential for continued upside, though caution is warranted. The Moving Average Convergence Divergence (MACD) histogram displayed widening positive bars, signalling that bullish momentum was strengthening. Volume analysis also showed heightened activity around 0.7264, implying that institutional investors were actively engaging at this level, possibly positioning for a breakout.

Macro drivers remain central to the outlook. The Australian Dollar’s performance is tied to the RBA’s policy trajectory and the broader health of the commodity sector. Any rebound in iron ore and coal prices could provide tailwinds for the currency. The US Dollar, however, continues to benefit from safe haven flows and higher yields, particularly during periods of global uncertainty. Geopolitical tensions, equity market volatility, or shifts in risk sentiment tend to favour the Dollar, reinforcing its defensive role. As such, AUDUSD’s direction will depend heavily on the balance between Australia’s commodity resilience and US monetary policy strength.

In conclusion, the high at 0.7264 marks a pivotal point for AUDUSD. If buyers sustain momentum above this level, a move toward 0.7350–0.7500 is plausible, supported by improving momentum signals. However, a failure to break above 0.7270 would expose the pair to renewed downside risks, potentially toward 0.7200 or 0.7150. The interplay between RBA caution and Federal Reserve hawkishness will determine whether this level becomes a durable resistance or a stepping stone to further gains.

#fxopen #forex #forexanalysis

Disclaimer: This analysis represents my own opinion only. It is not to be construed as an opinion, offer, solicitation, recommendation, or financial advice of the Companies operating under the FXOpen brand.

For in-depth analysis, please check ...
 
EURCHF Technical Analysis – 14 MAY, 2026
EURCHF – On 14 May 2026, the Euro against the Swiss Franc (EURCHF) registered a notable high at 0.9159

wFrcxkny_o.png


Technical Analysis: EURCHF – High 0.9159 (14 May 2026)

On 14 May 2026, the Euro against the Swiss Franc (EURCHF) registered a notable high at 0.9159. This level is significant because it reflects a corrective rebound in the pair following recent weakness and highlights the interplay between Eurozone fundamentals and the Swiss Franc’s safe haven appeal. The move underscores both technical and fundamental dynamics that have shaped the pair’s trajectory in recent sessions.

The broader context leading into mid May 2026 was one of cautious optimism in the Eurozone. The European Central Bank (ECB) maintained a balanced stance, attempting to support growth while keeping inflation under control. Meanwhile, the Swiss National Bank (SNB) continued to emphasize stability, but its relatively accommodative policy limited the Franc’s ability to appreciate. Global investors, while still viewing the Franc as a safe haven asset, favoured the Euro in periods of risk on sentiment, contributing to EURCHF’s rebound toward the 0.9159 level.

From a technical perspective, the 0.9159 high coincides with the upper boundary of a short term corrective rally within a broader consolidation range that has guided price action since late 2025. This range reflects repeated tests of support near 0.9100 and resistance near 0.9160, suggesting indecision among market participants. The retest of 0.9159 indicates that buyers were attempting to push the pair higher, but the level also represents a critical resistance zone. A decisive break above 0.9160 would expose the pair to further upside risks, with the next resistance near 0.9220, derived from prior swing highs and Fibonacci extension levels. Conversely, failure to break above 0.9159 would reinforce the consolidation pattern, keeping the pair range bound.

Support levels are equally well defined. The immediate floor is at 0.9115, coinciding with the 50 day moving average. A sustained break below this level would signal a potential corrective pullback, opening the path toward 0.9050, where the 200 day moving average converges with prior swing lows. This zone represents a formidable cushion, and only a decisive breach would alter the medium term outlook.

Momentum indicators provide further clarity. The Relative Strength Index (RSI) hovered near 56 at the time of the high, indicating that the pair was approaching overbought territory but still within neutral bounds. This positioning suggests potential for continued upside, though caution is warranted. The Moving Average Convergence Divergence (MACD) histogram displayed widening positive bars, signalling that bullish momentum was strengthening. Volume analysis also showed heightened activity around 0.9159, implying that institutional investors were actively engaging at this level, possibly positioning for a breakout.

Macro drivers remain central to the outlook. The Euro’s performance is tied to the ECB’s policy trajectory and the broader health of the Eurozone economy. Any signs of stronger growth or inflationary pressures could support the currency. The Swiss Franc, however, continues to benefit from safe haven flows, particularly during periods of global uncertainty. Geopolitical tensions, equity market volatility, or shifts in risk sentiment tend to favour the Franc, reinforcing its defensive role. As such, EURCHF’s direction will depend heavily on the balance between Eurozone recovery prospects and SNB caution.

In conclusion, the high at 0.9159 marks a pivotal point for EURCHF. If buyers sustain momentum above this level, a move toward 0.9220 is plausible, supported by improving momentum signals. However, a failure to break above 0.9160 would expose the pair to renewed downside risks, potentially toward 0.9115 or 0.9050. The interplay between ECB policy and SNB’s safe haven credibility will determine whether this level becomes a durable resistance or a stepping stone to further gains.

#fxopen #forex #forexanalysis

Disclaimer: This analysis represents my own opinion only. It is not to be construed as an opinion, offer, solicitation, recommendation, or financial advice of the Companies operating under the FXOpen brand.

For in-depth analysis, please check ...
 
Back
Top