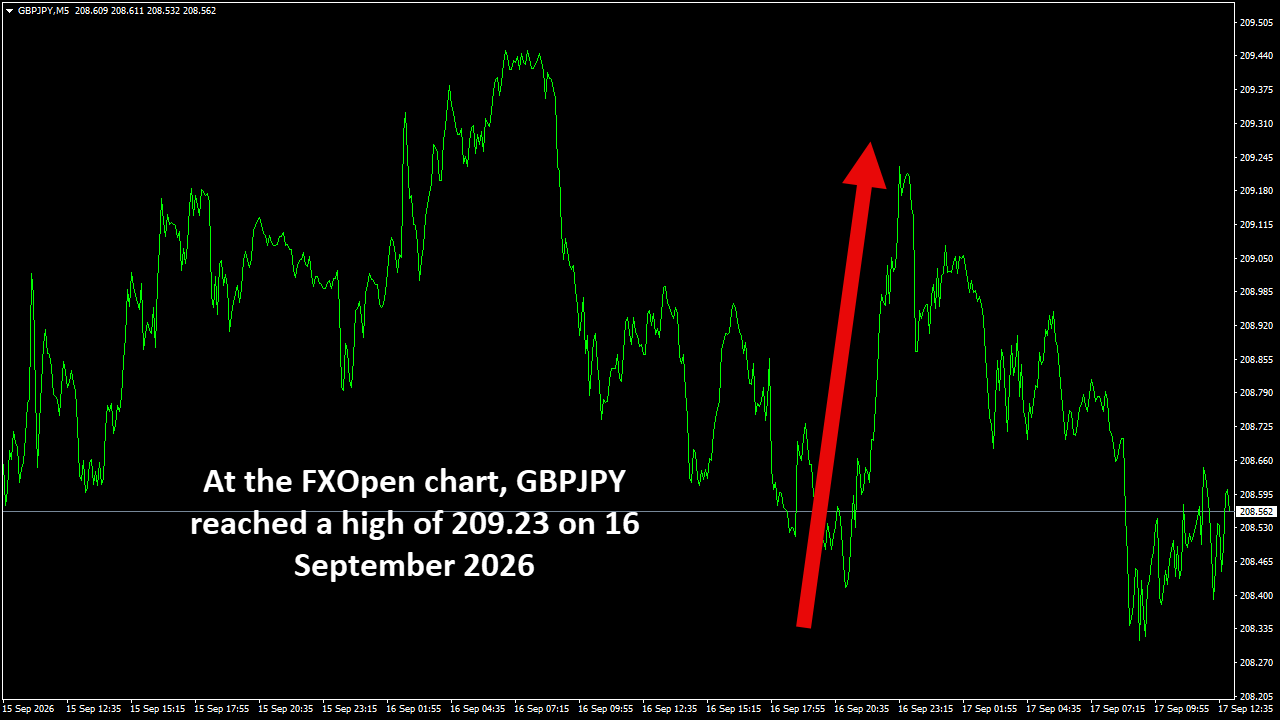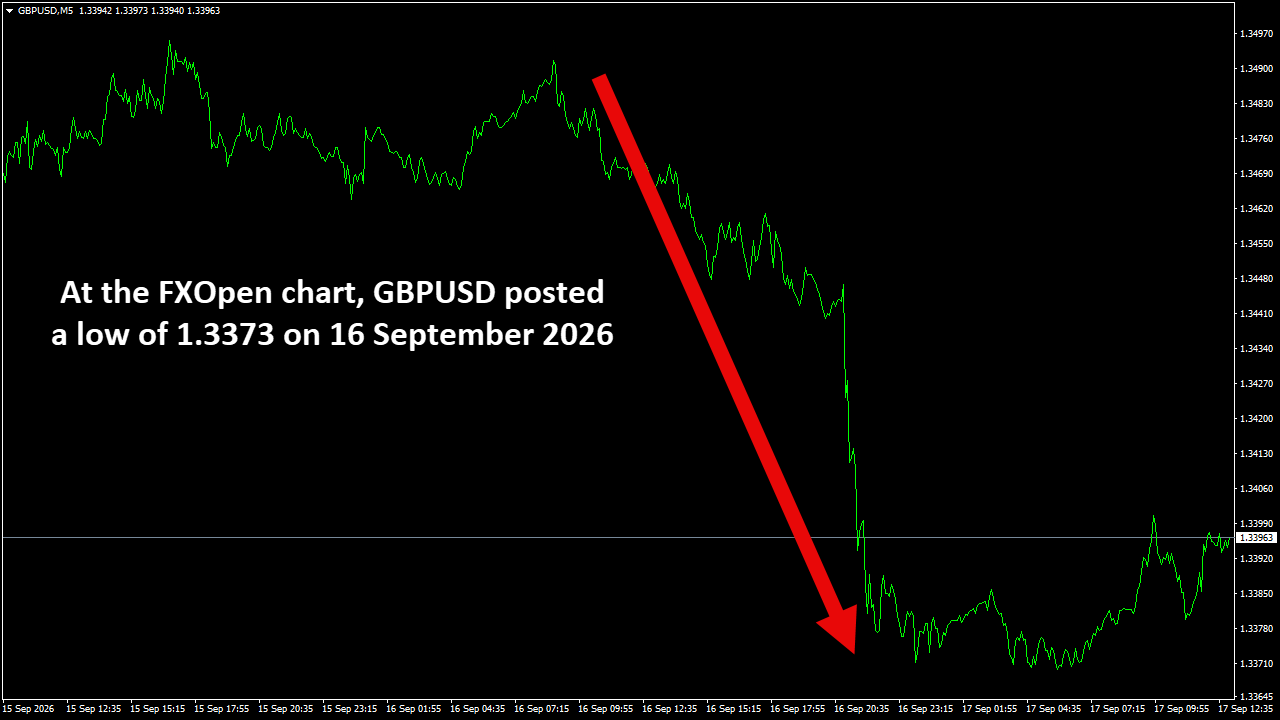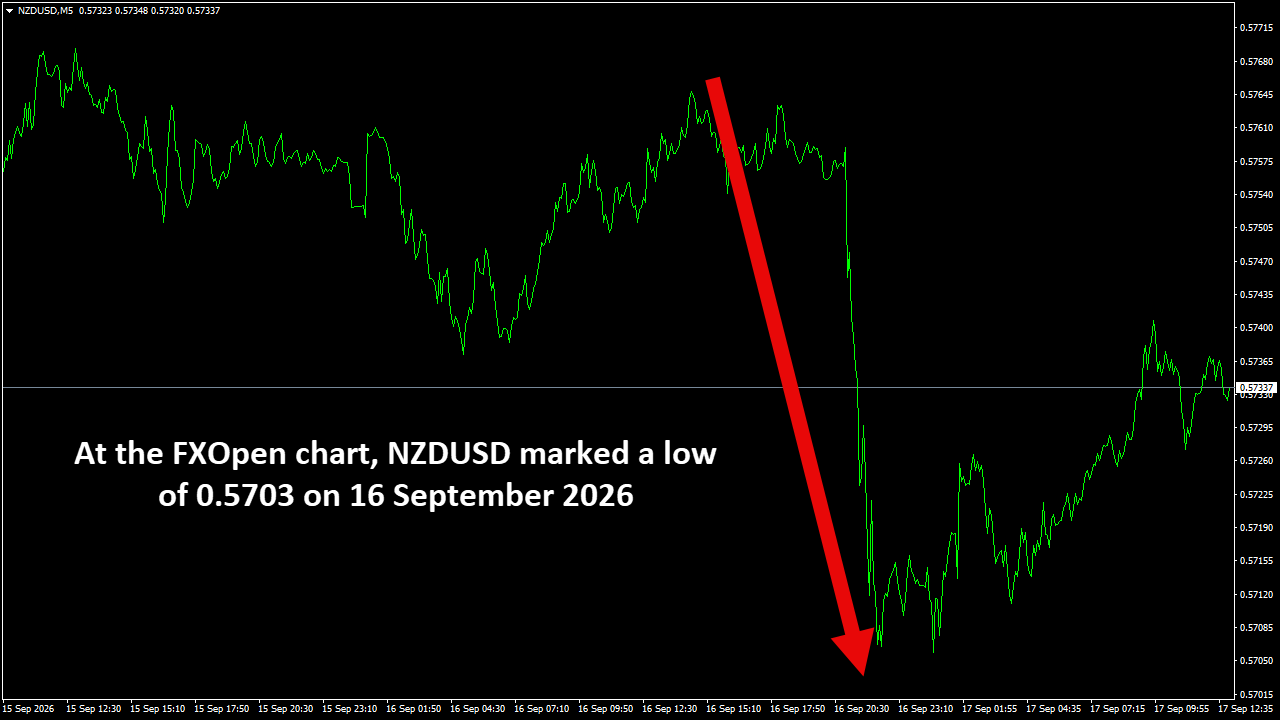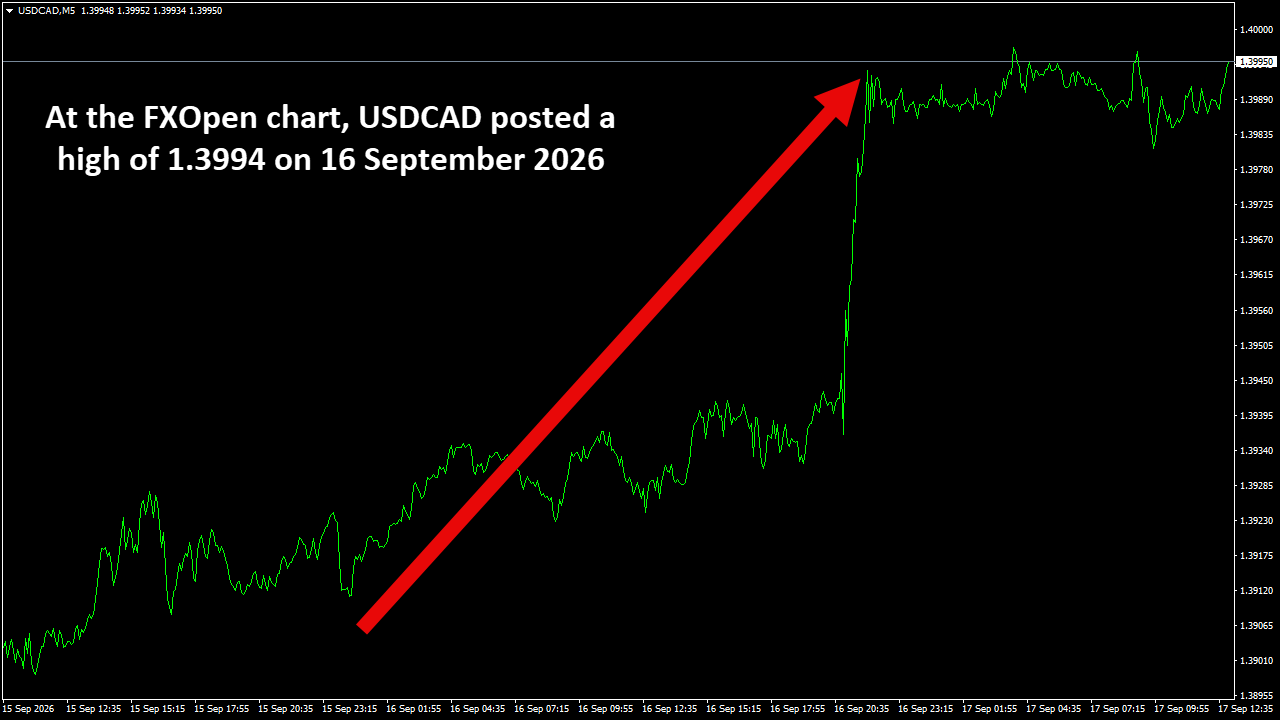
AUDUSD Technical Analysis – 23 Aug, 2026
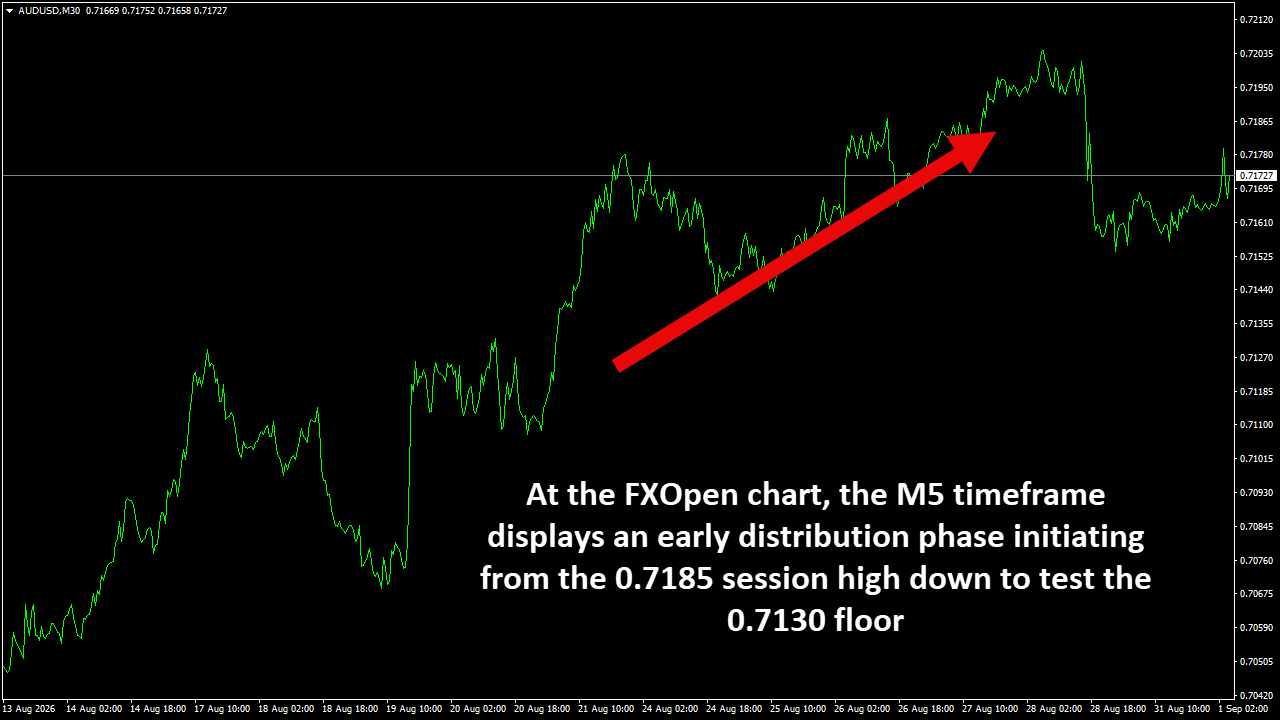
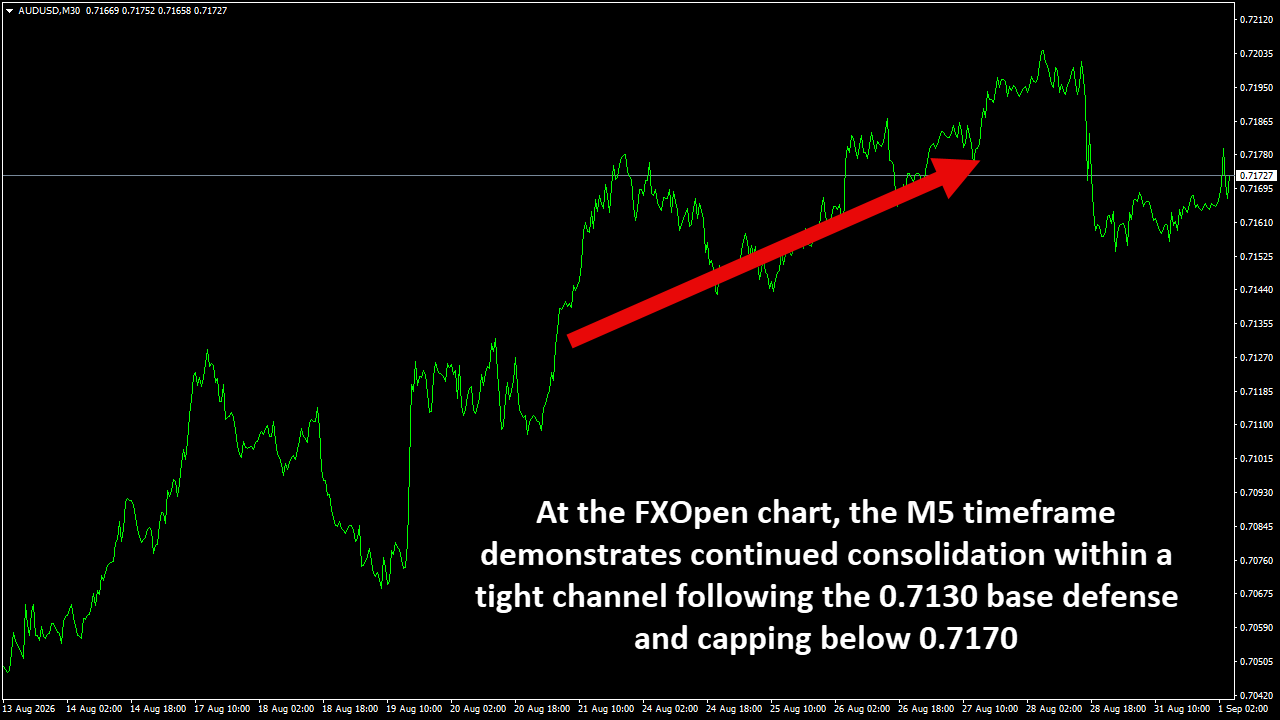
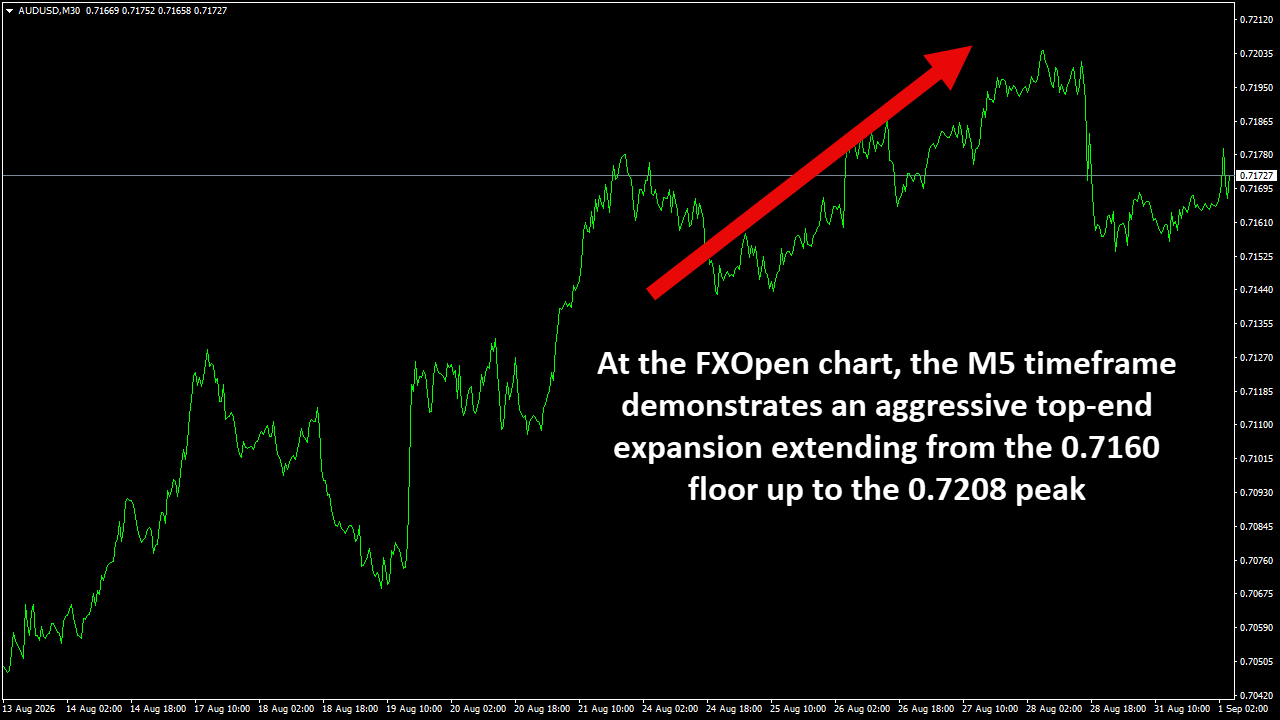
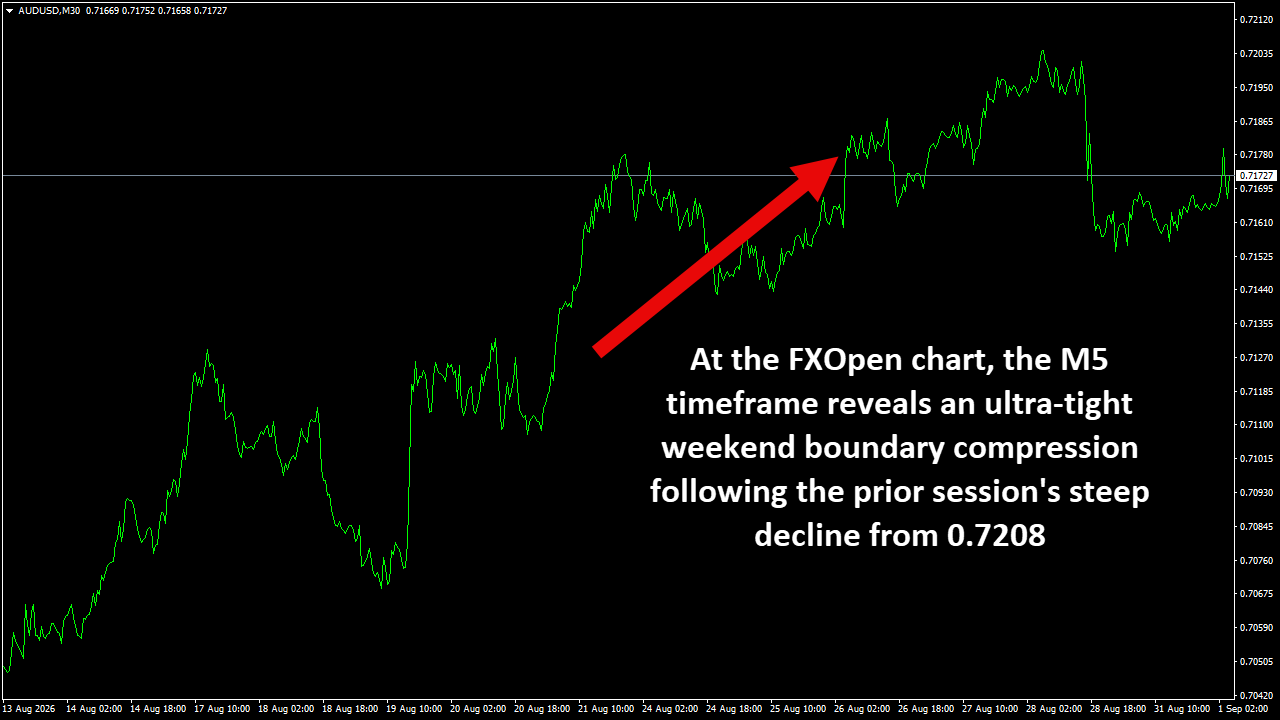
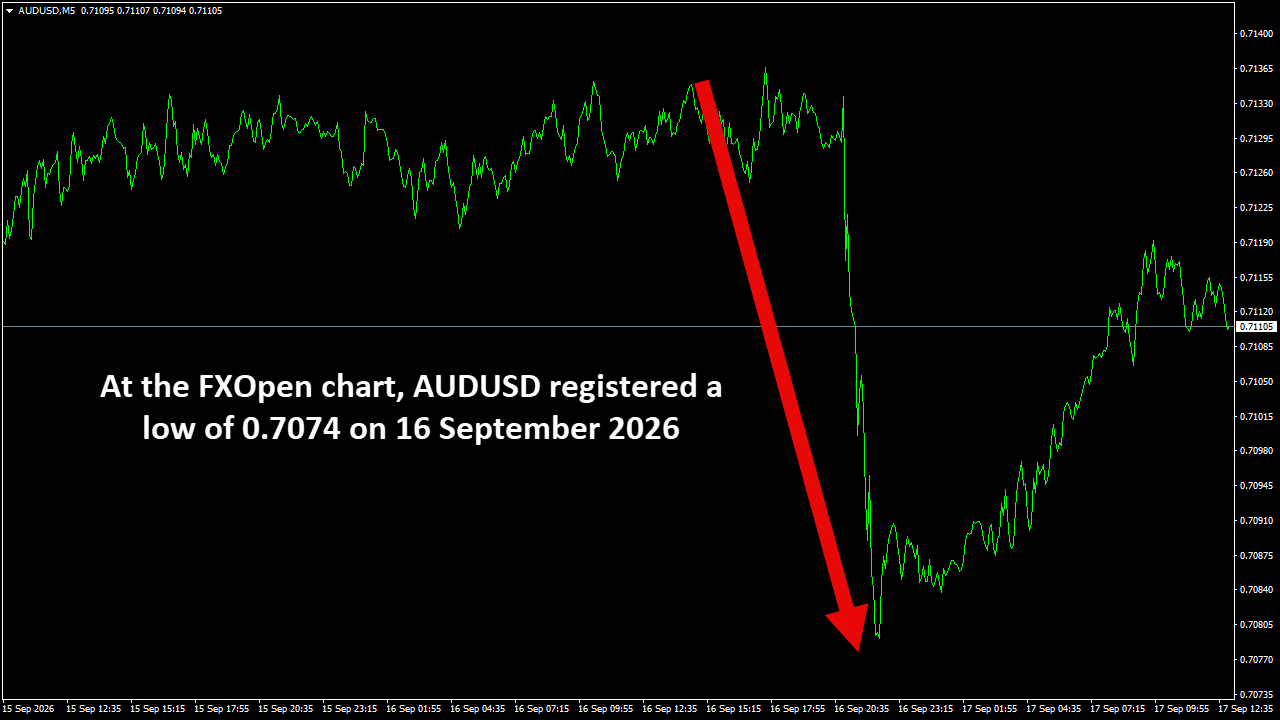
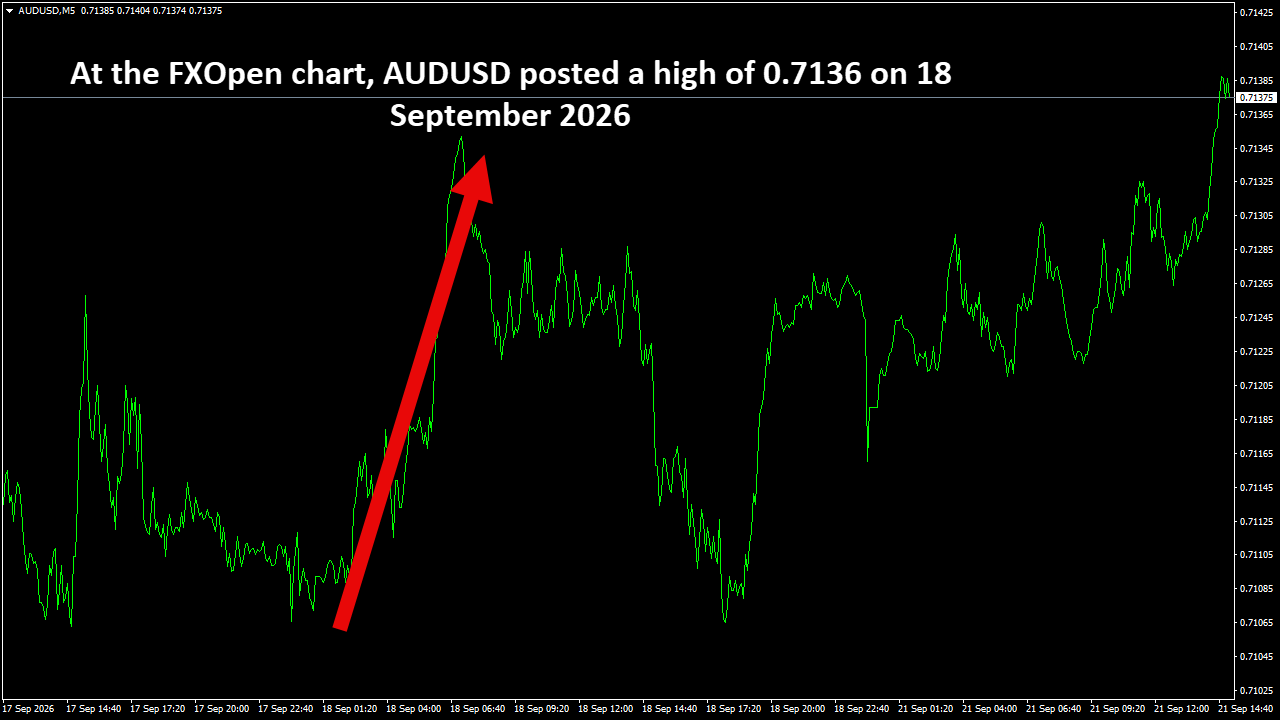
AUDUSD – At the FXOpen chart, the M5 timeframe illustrates a tightly compressed consolidation channel following the preceding rejection near 0.7180
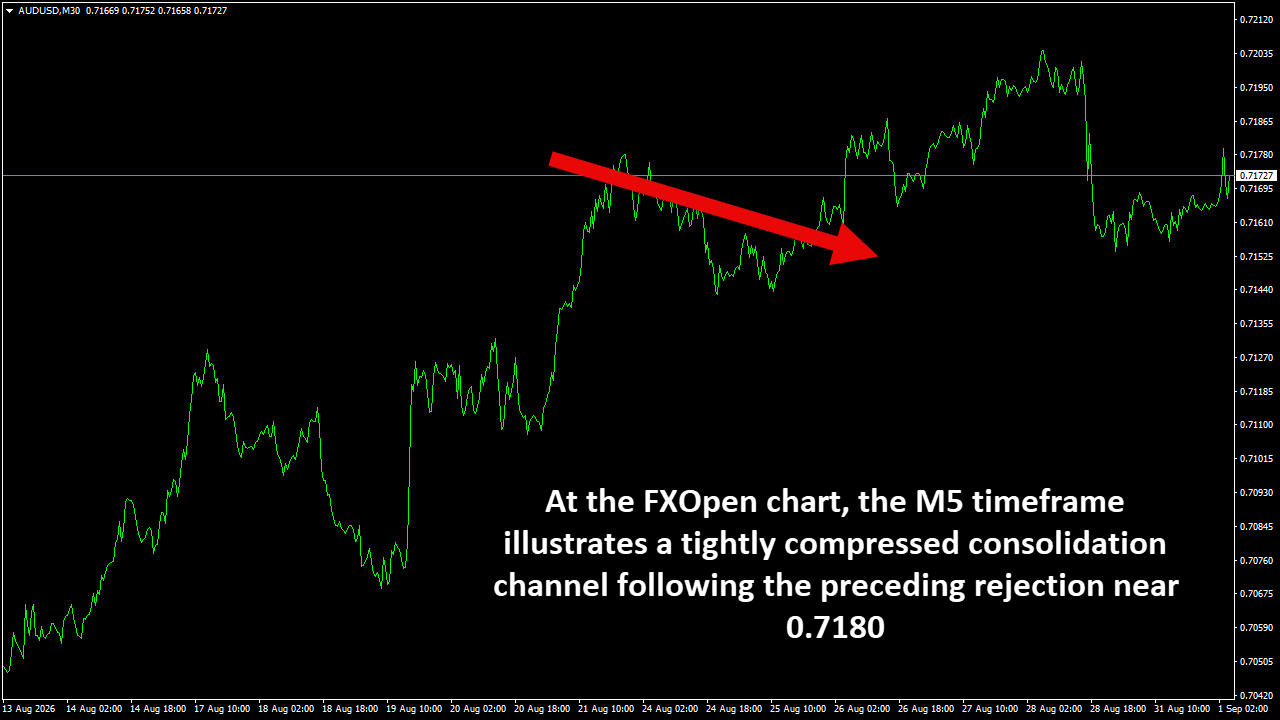
AUDUSD – High: 0.7170 | Low: 0.7145 – Date 23 Aug 2026
At the FXOpen chart, the M5 timeframe illustrates a tightly compressed consolidation channel following the preceding rejection near 0.7180. Price action is holding along a narrow shelf above the 0.7145 floor, while the descending 20-period EMA caps upside probes at 0.7170. Order flow shows low weekend session participation, with volume histograms heavily diminished. Oscillators remain flattened near the neutral midline. A sustained 5-minute close above 0.7170 unlocks momentum toward the 0.7195 liquidity shelf, whereas losing the 0.7145 baseline opens room for a sweep of sell-side liquidity down to the 0.7115 demand area.
#fxopen #forex #forexanalysis
Disclaimer: This analysis represents my own opinion only. It is not to be construed as an opinion, offer, solicitation, recommendation, or financial advice of the Companies operating under the FXOpen brand.
EURCHF Technical Analysis – 23Aug, 2026
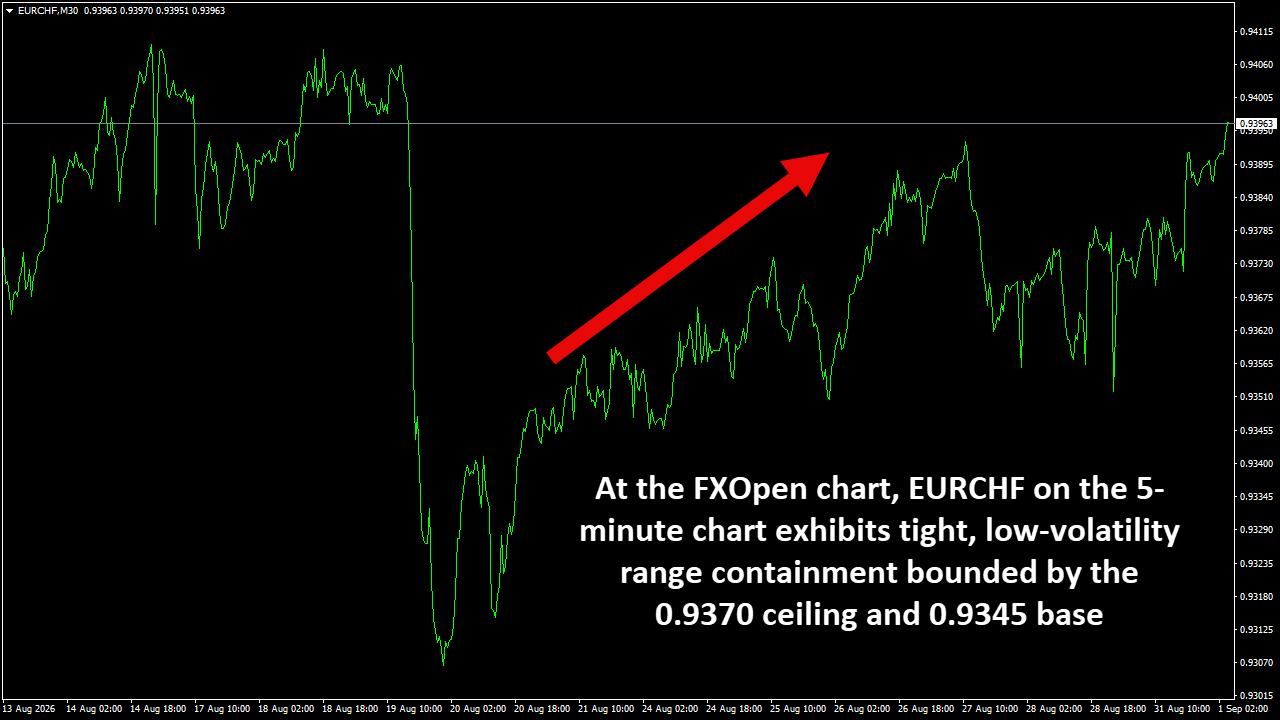
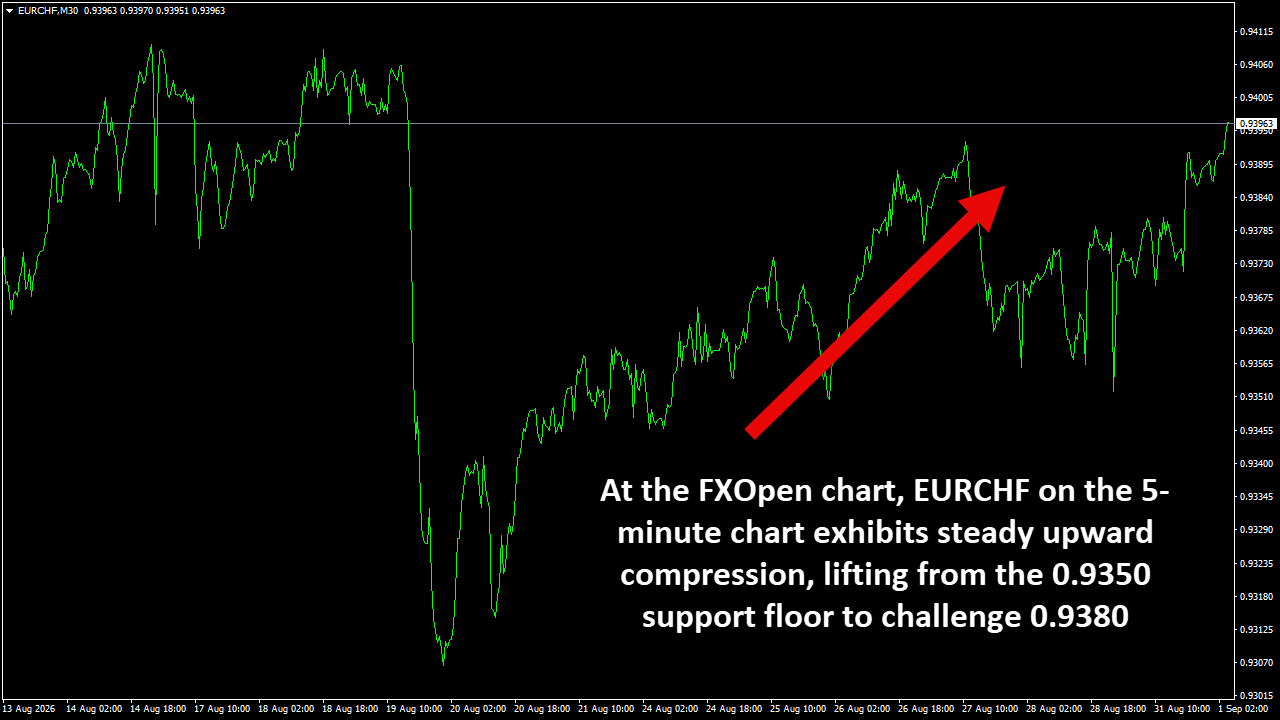
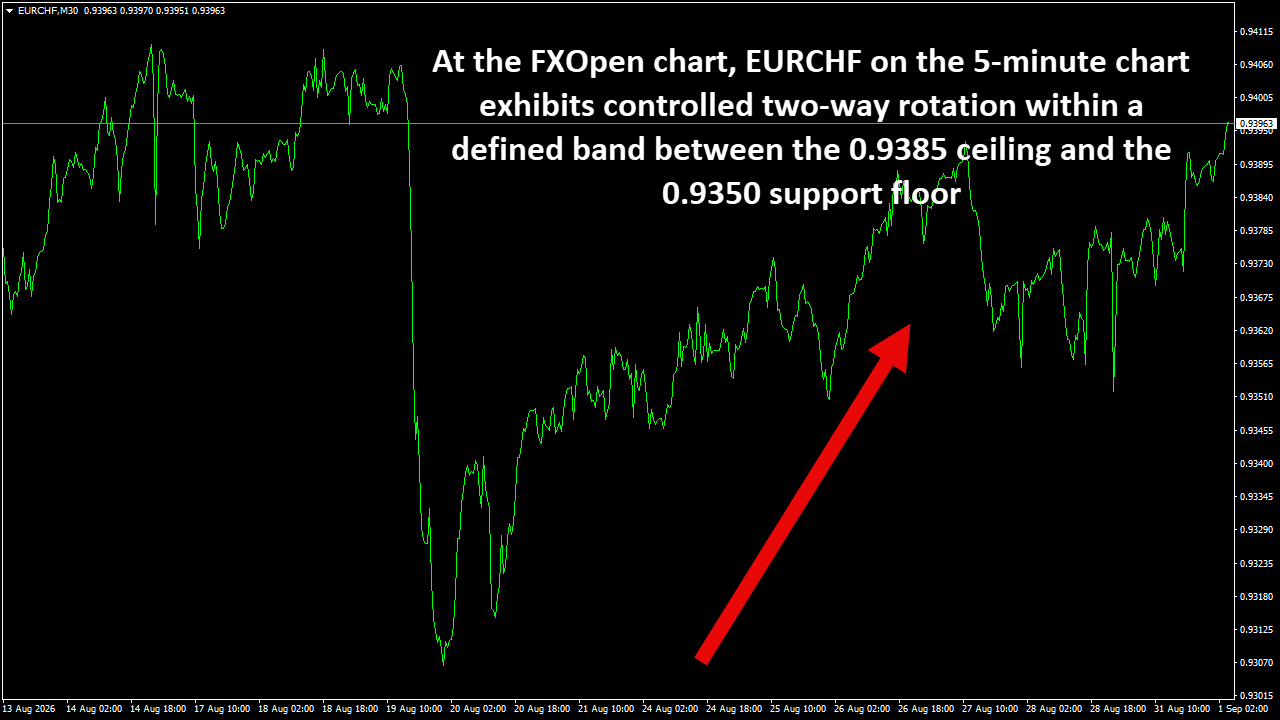
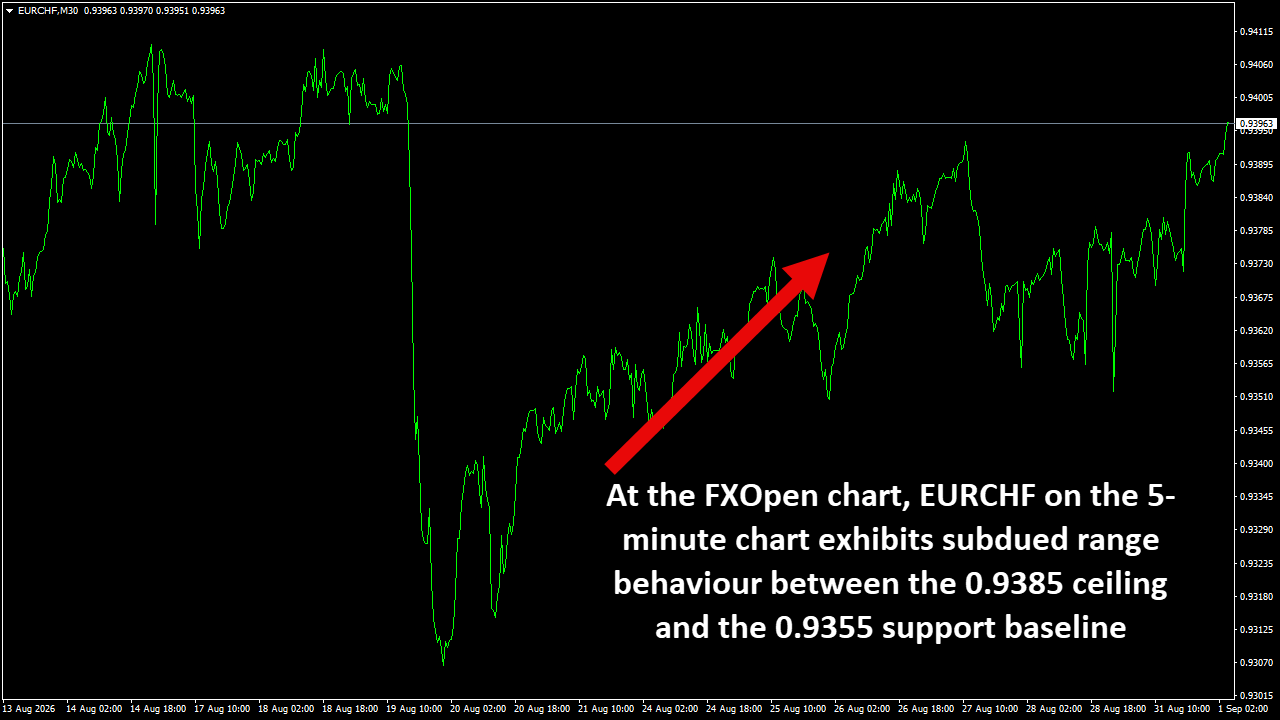
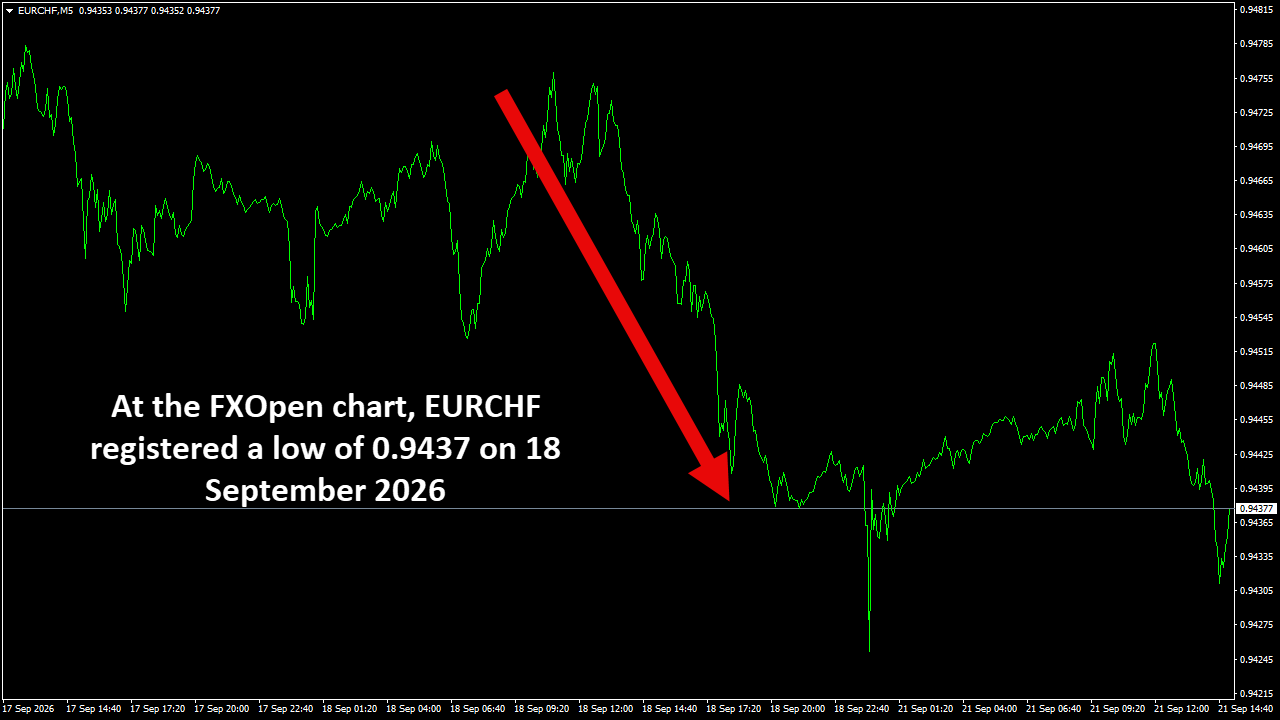
EURCHF – At the FXOpen chart, EURCHF on the 5-minute chart exhibits subdued range behaviour between the 0.9360 ceiling and the 0.9335 support baseline
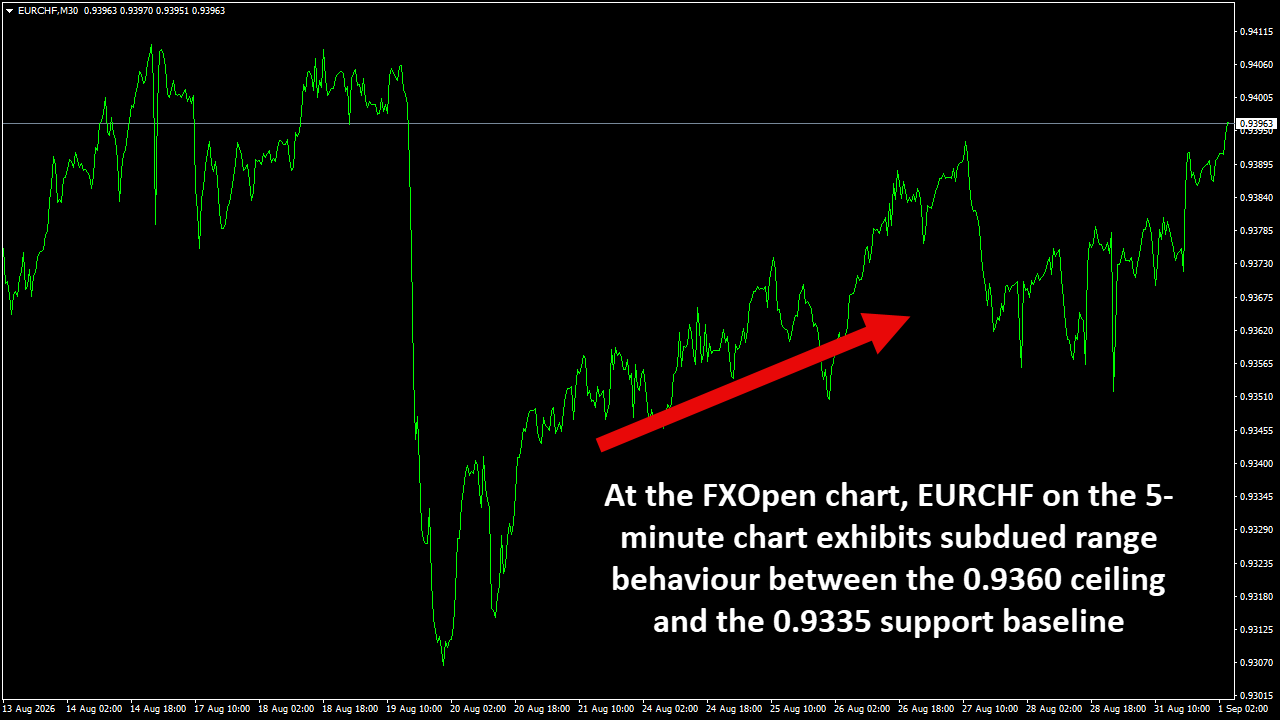
EURCHF – High: 0.9360 | Low: 0.9335 – Date 23 Aug 2026
At the FXOpen chart, EURCHF on the 5-minute chart exhibits subdued range behaviour between the 0.9360 ceiling and the 0.9335 support baseline. The pair continues to oscillate around the volume-weighted median of 0.9348, printing small candle bodies and compressed Bollinger Bands. The 20-period and 50-period EMAs remain tightly intertwined, indicating complete structural equilibrium. A decisive push through 0.9360 is required to attract momentum buyers toward 0.9385, whereas a break below the 0.9335 floor leaves the pair vulnerable to extended distribution toward the 0.9310 support zone.
#fxopen #forex #forexanalysis
Disclaimer: This analysis represents my own opinion only. It is not to be construed as an opinion, offer, solicitation, recommendation, or financial advice of the Companies operating under the FXOpen brand.
EURJPY Technical Analysis – 23 Aug, 2026
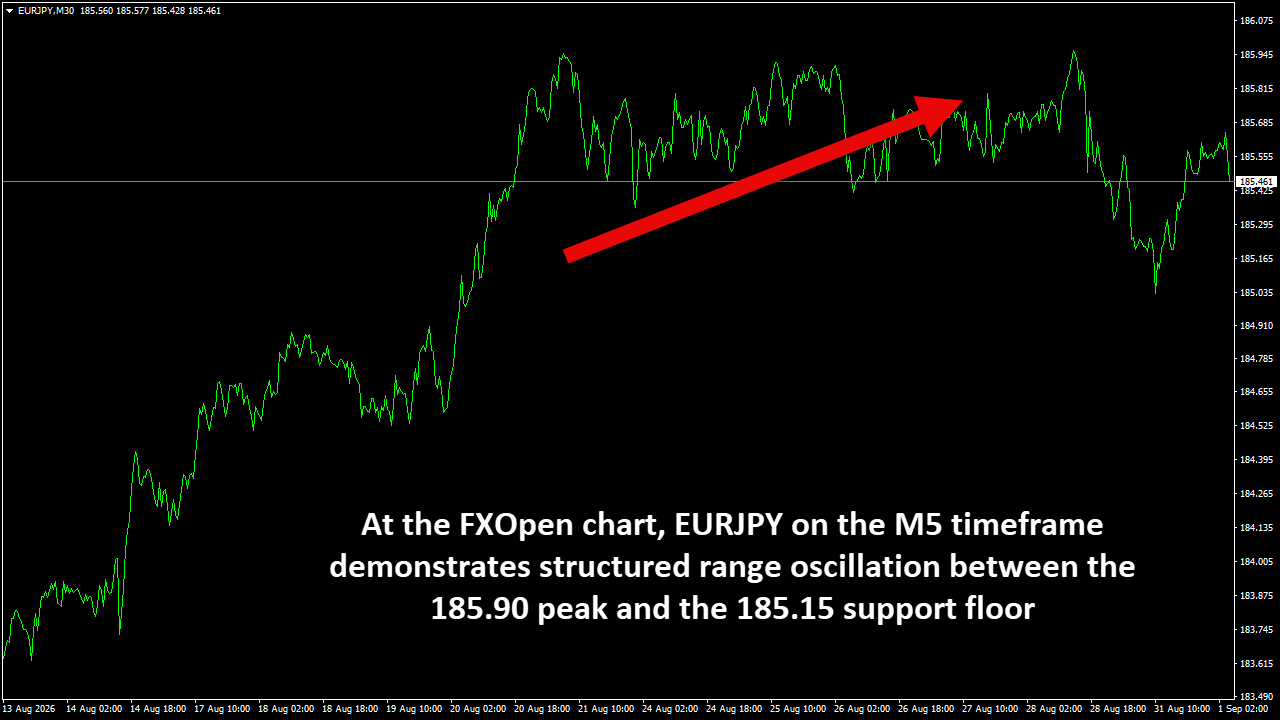
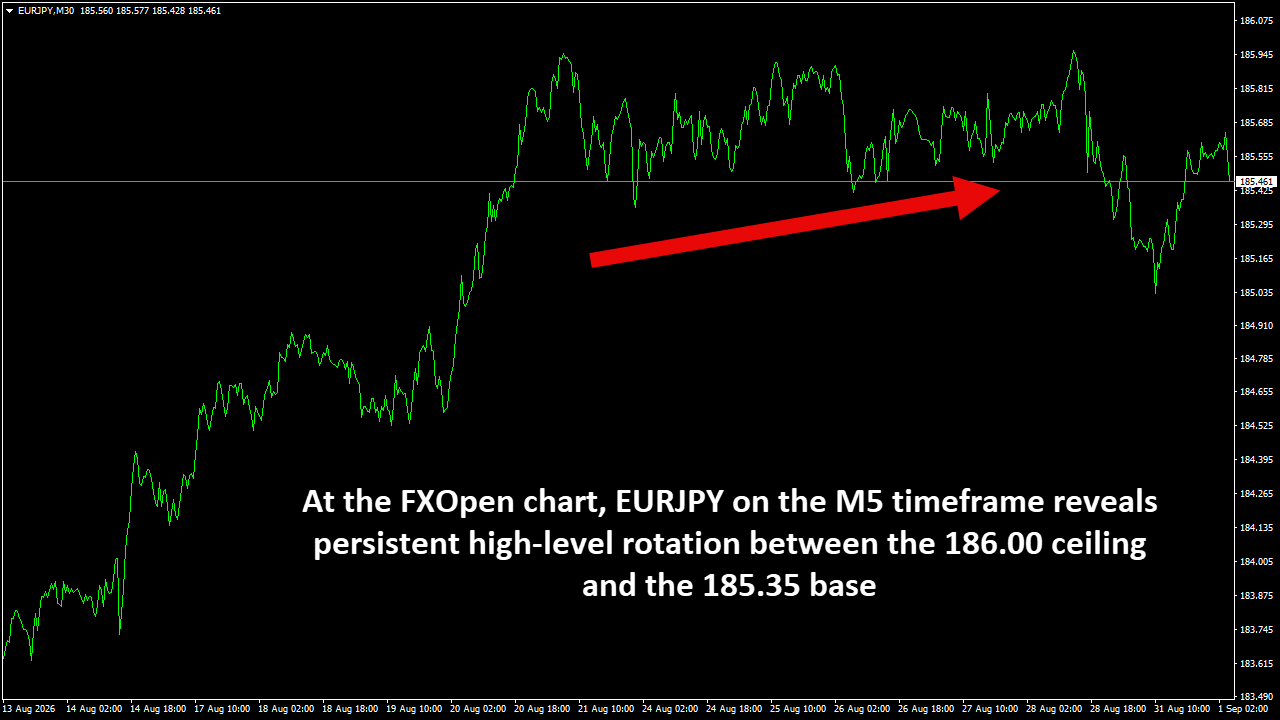
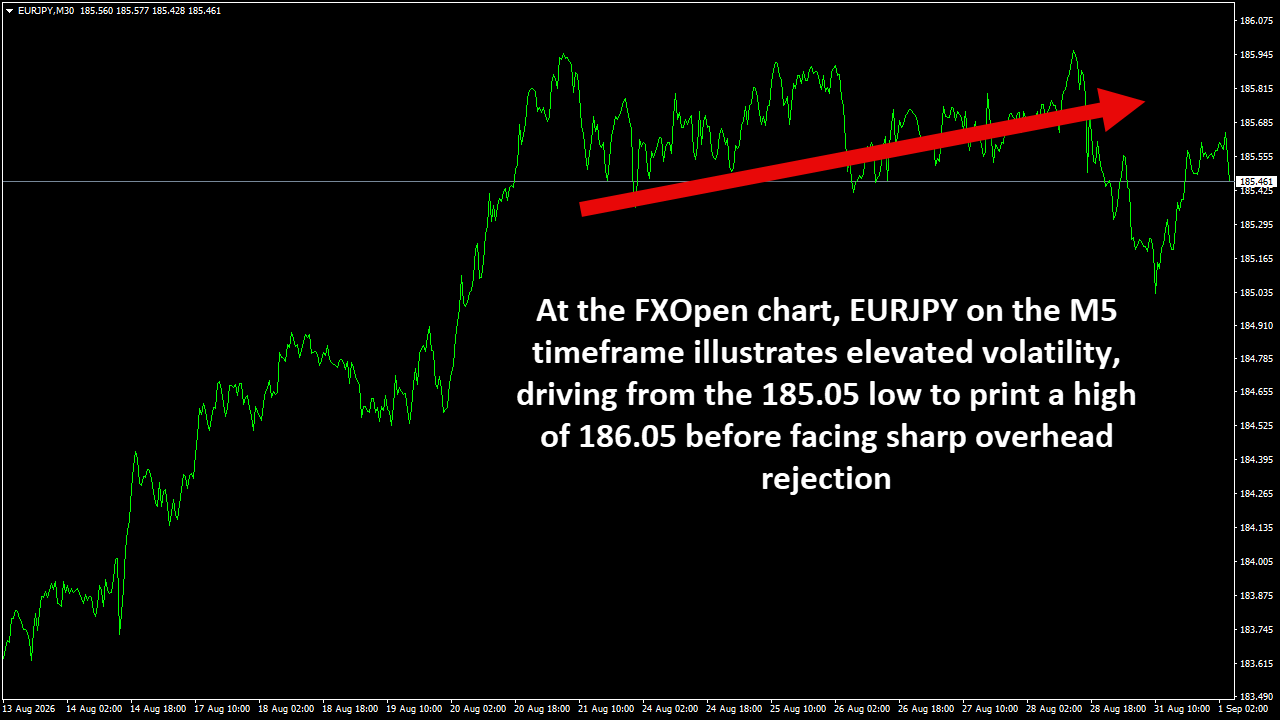
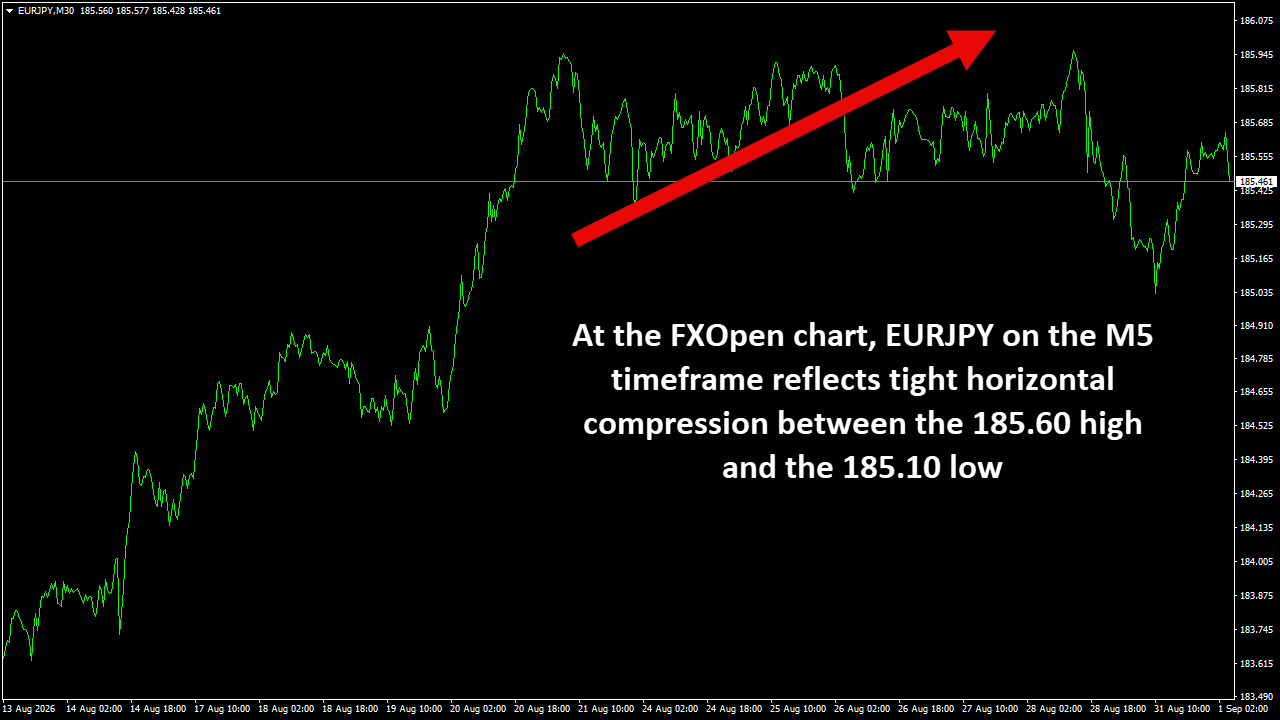
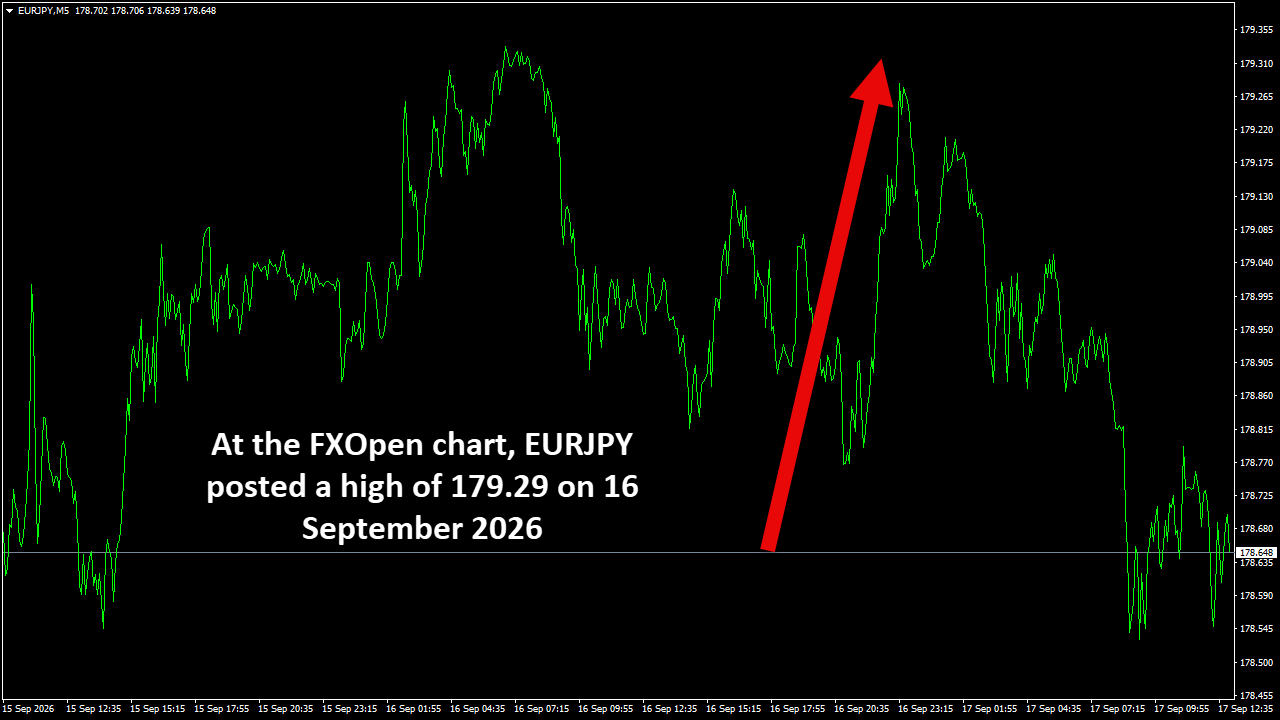
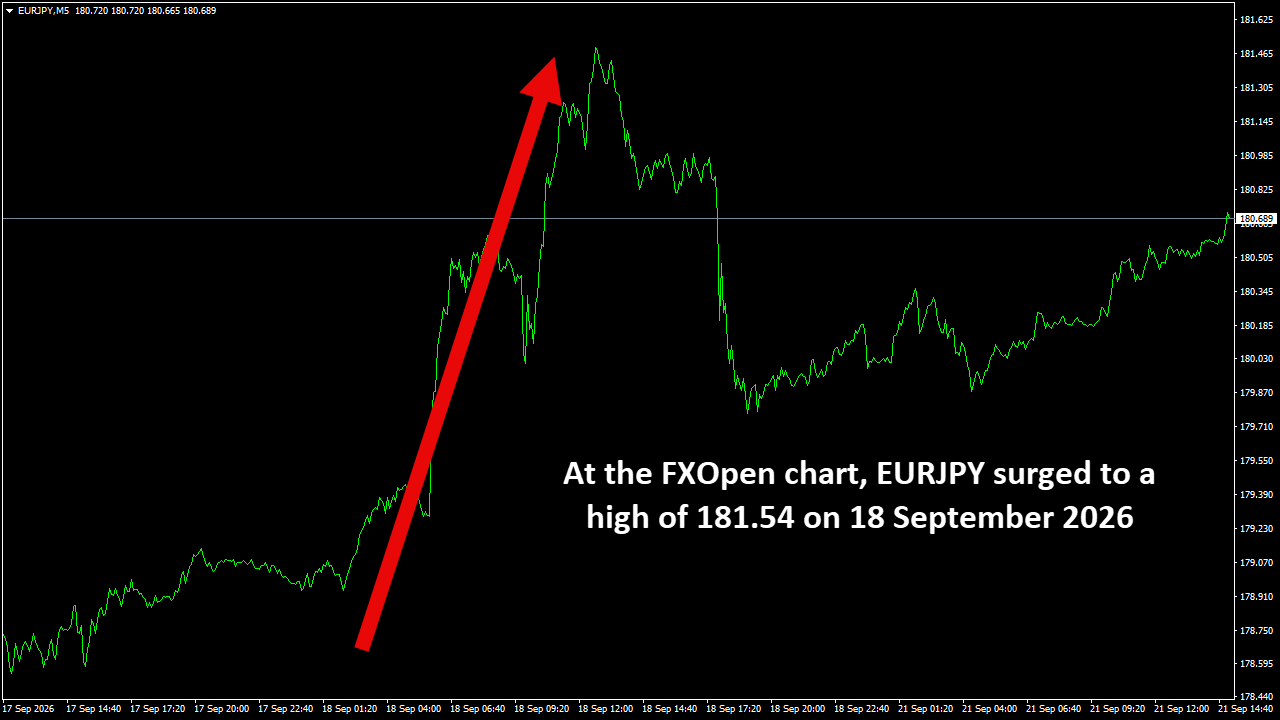
EURJPY – At the FXOpen chart, EURJPY on the M5 timeframe reflects tight horizontal compression between the 185.75 high and the 185.10 low
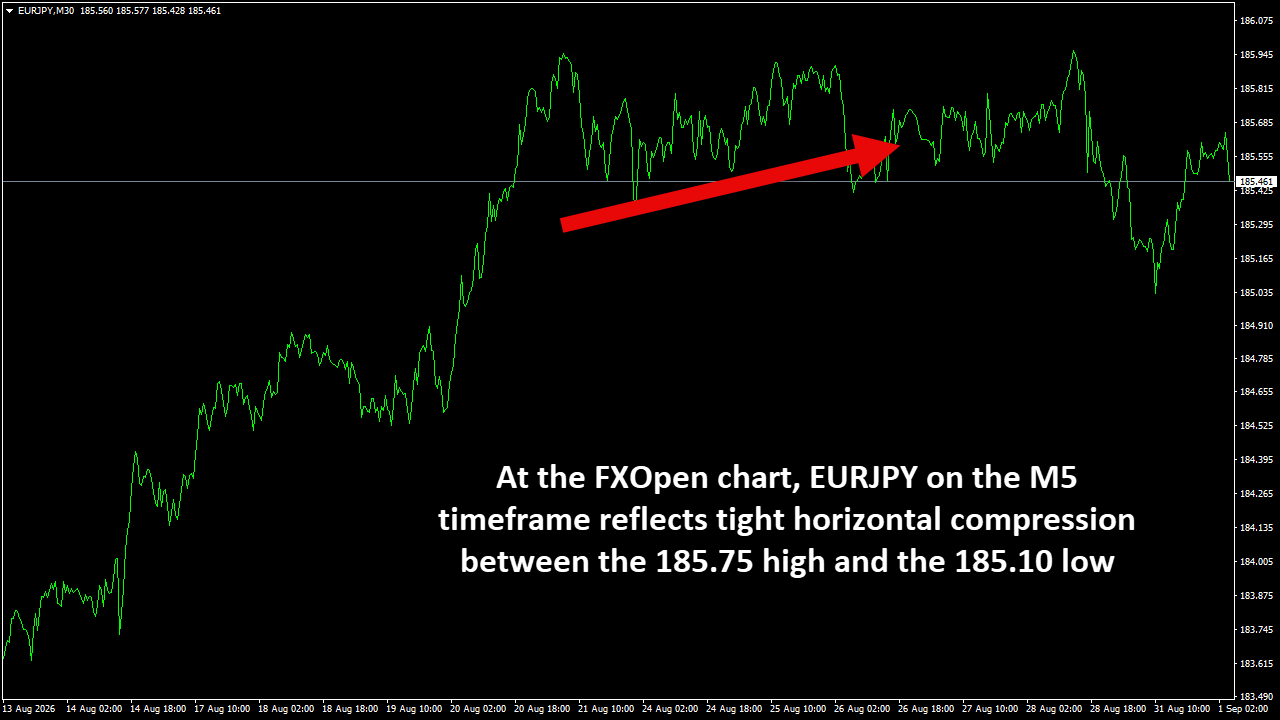
EURJPY – High: 185.75 | Low: 185.10 – Date 23 Aug 2026
At the FXOpen chart, EURJPY on the M5 timeframe reflects tight horizontal compression between the 185.75 high and the 185.10 low. Price action maintains a mild ascending base above 185.25, with buyers absorbing minor pullbacks into the 50-period EMA. The relative strength index hovers near 51, confirming a balanced order book ahead of the weekly open. A high-volume breach of 185.75 targets an immediate test of 186.10, while a breakdown below the 185.10 floor opens the pathway for a deeper corrective slide toward 184.50.
#fxopen #forex #forexanalysis
Disclaimer: This analysis represents my own opinion only. It is not to be construed as an opinion, offer, solicitation, recommendation, or financial advice of the Companies operating under the FXOpen brand.
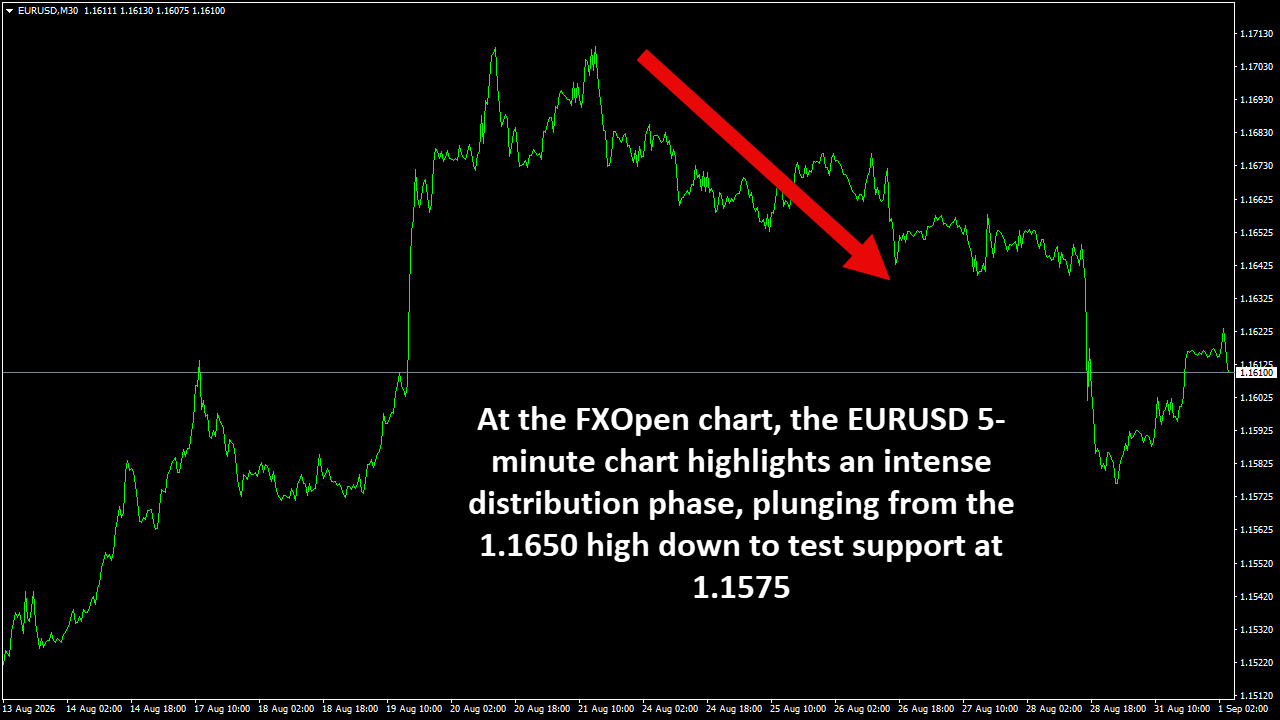
EURUSD Technical Analysis – 23 Aug, 2026
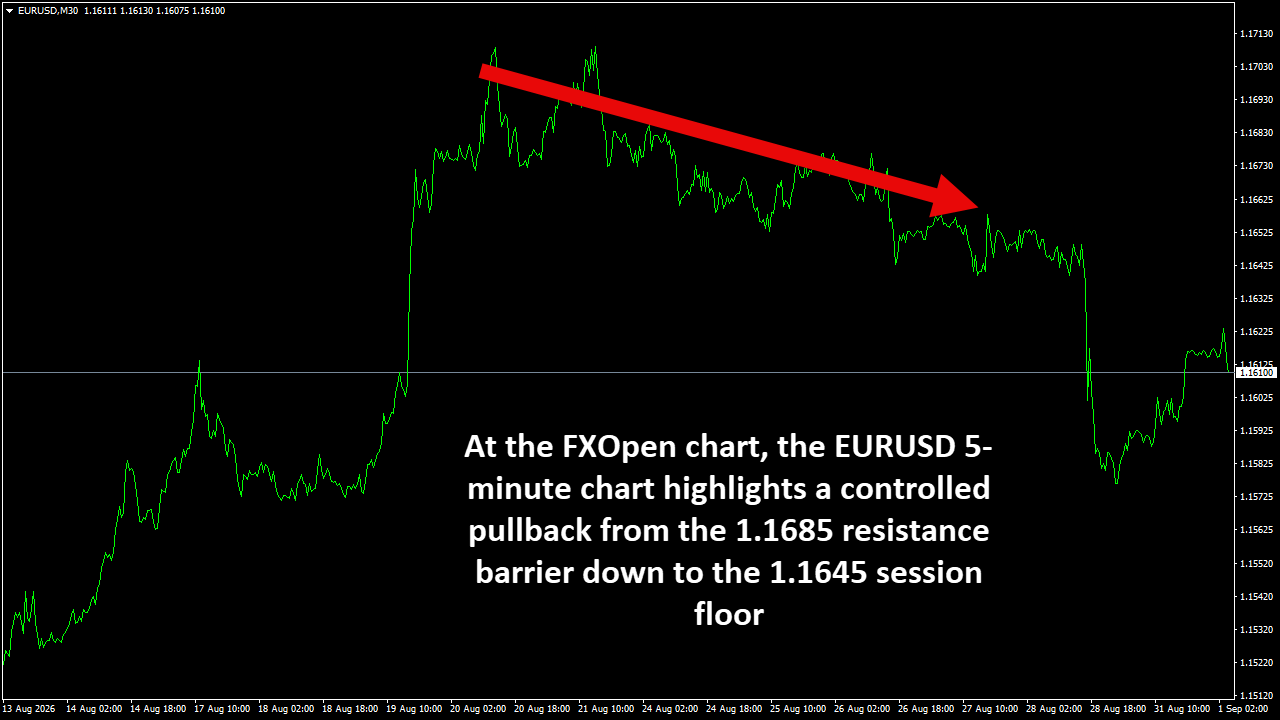
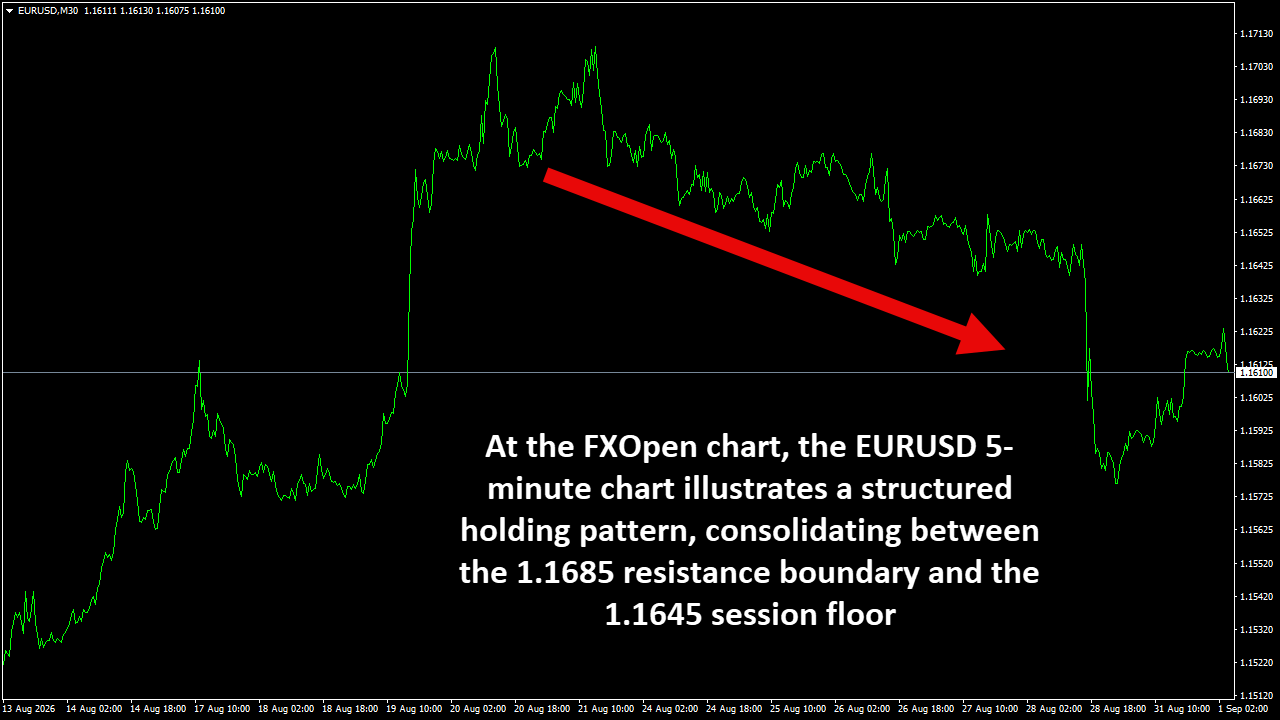
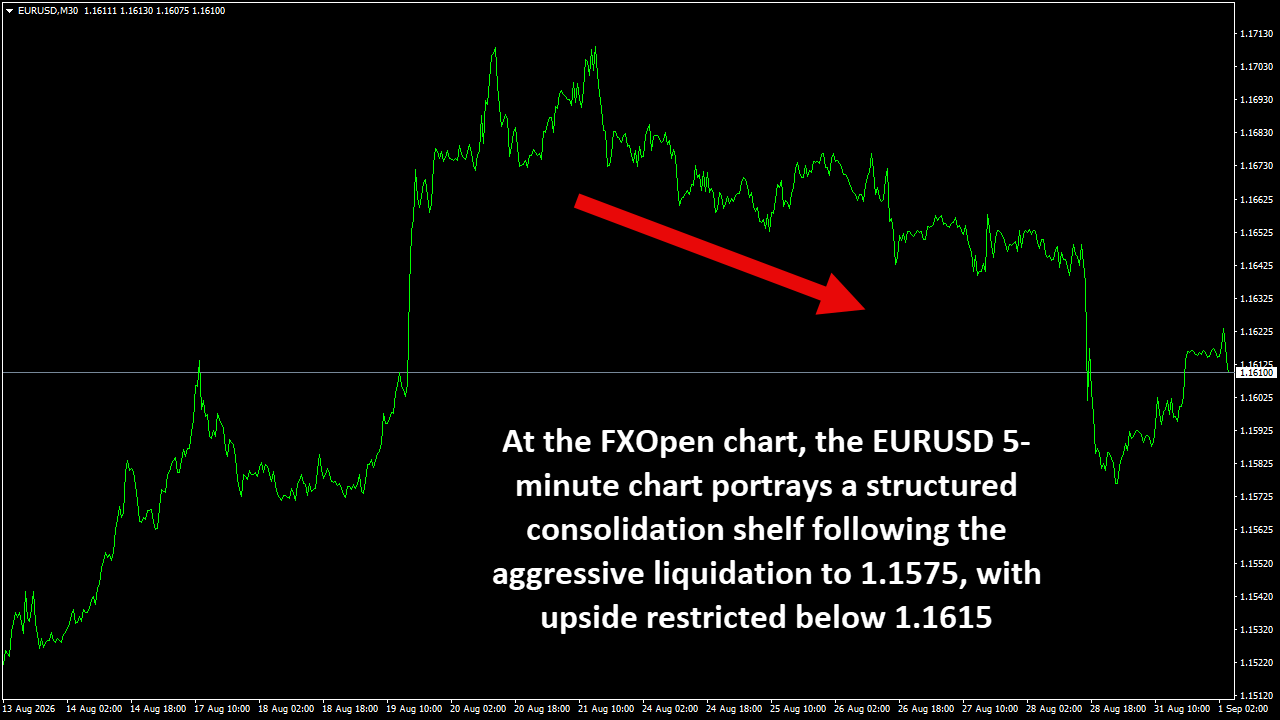
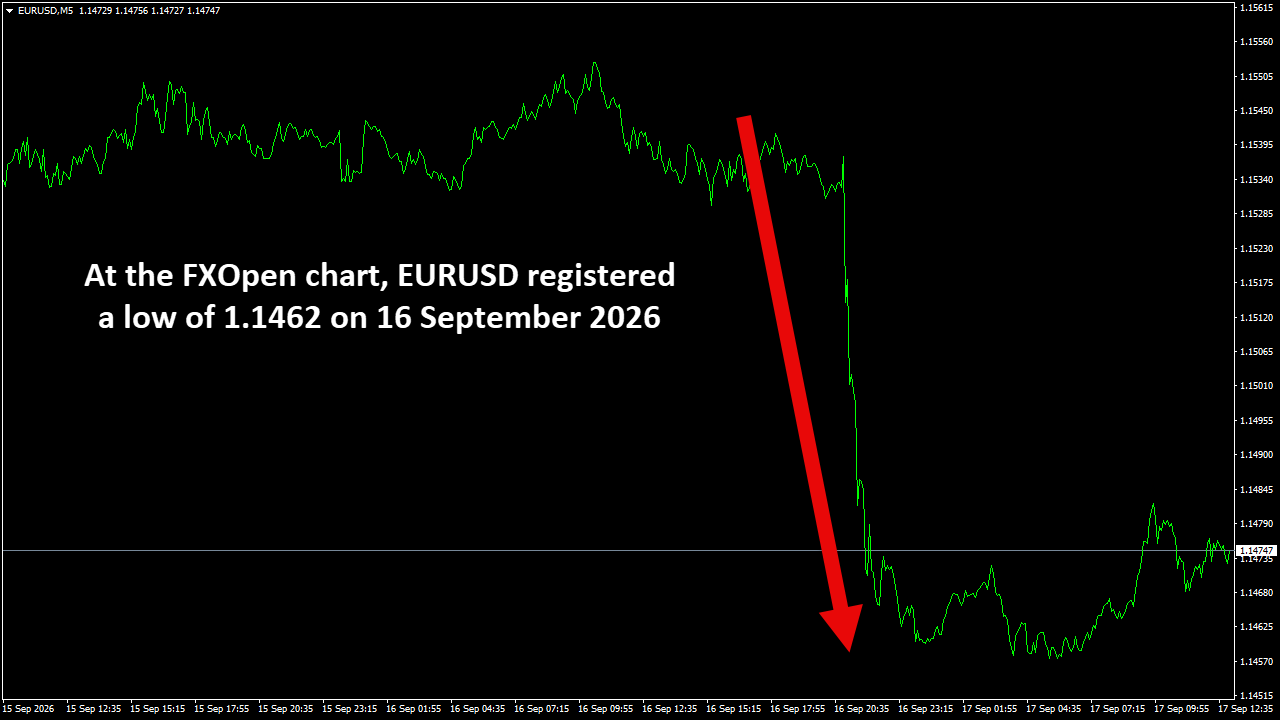
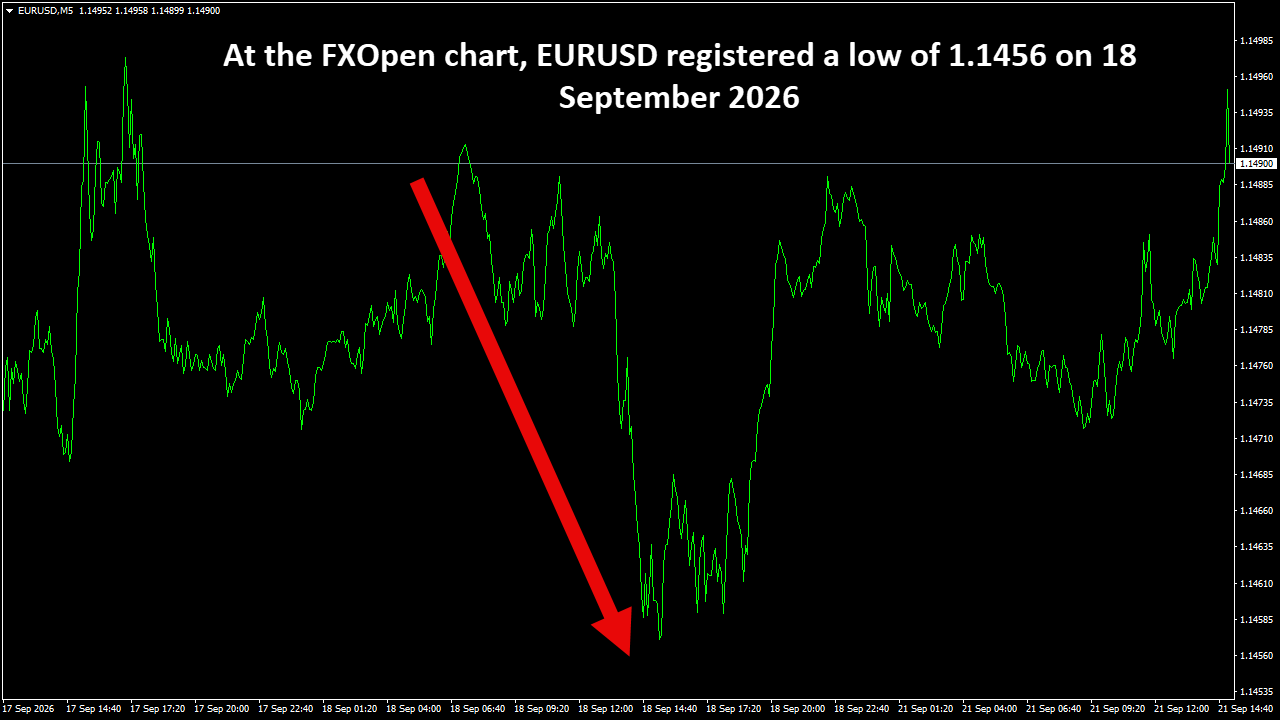
EURUSD – At the FXOpen chart, the EURUSD 5-minute chart portrays a structured holding pattern following the late-week rejection at 1.1715, establishing support at 1.1660 and a local ceiling at 1.1695
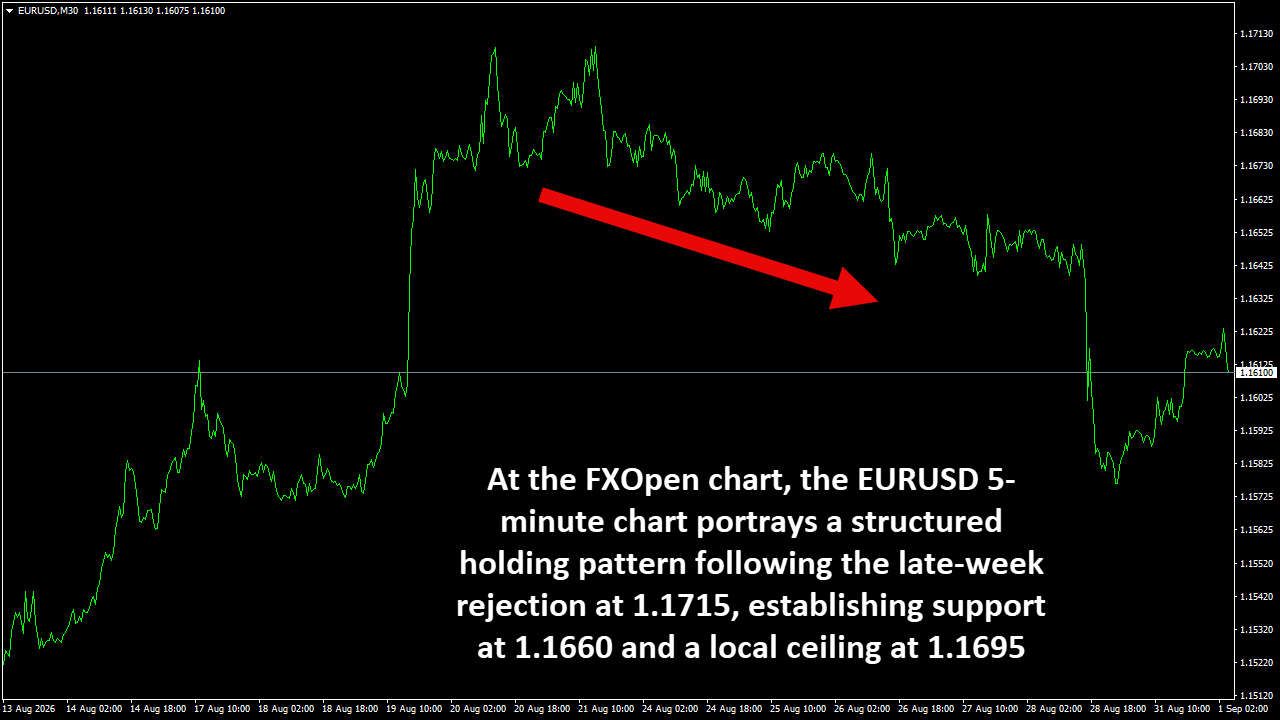
EURUSD – High: 1.1695 | Low: 1.1660 – Date 23 Aug 2026
At the FXOpen chart, the EURUSD 5-minute chart portrays a structured holding pattern following the late-week rejection at 1.1715, establishing support at 1.1660 and a local ceiling at 1.1695. The pair trades in a narrow consolidation wedge, with the 20-period EMA providing dynamic resistance near 1.1680. The RSI has normalized to neutral levels, leaving room for expansion upon session breakout. A confirmed move above 1.1695 establishes bullish continuation toward 1.1725, whereas an M5 breakdown under 1.1660 risks an intraday corrective swing toward 1.1625.
#fxopen #forex #forexanalysis
Disclaimer: This analysis represents my own opinion only. It is not to be construed as an opinion, offer, solicitation, recommendation, or financial advice of the Companies operating under the FXOpen brand.
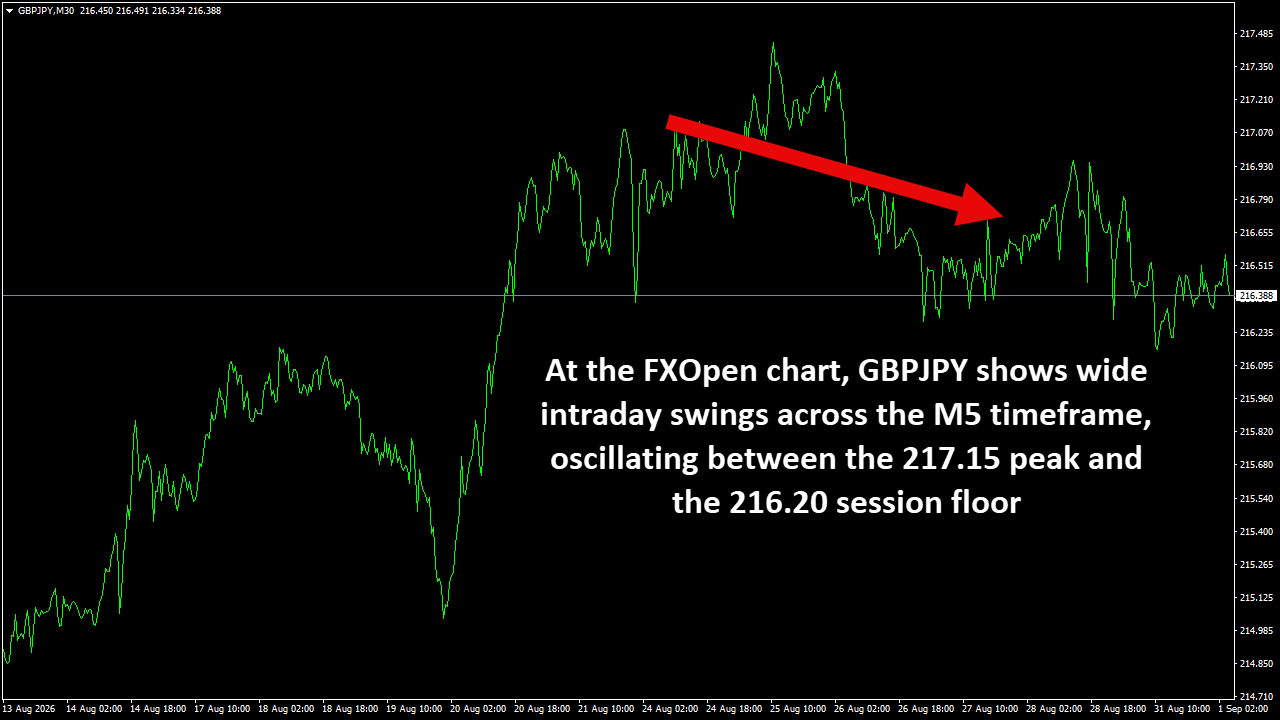
GBPJPY Technical Analysis – 23 Aug, 2026
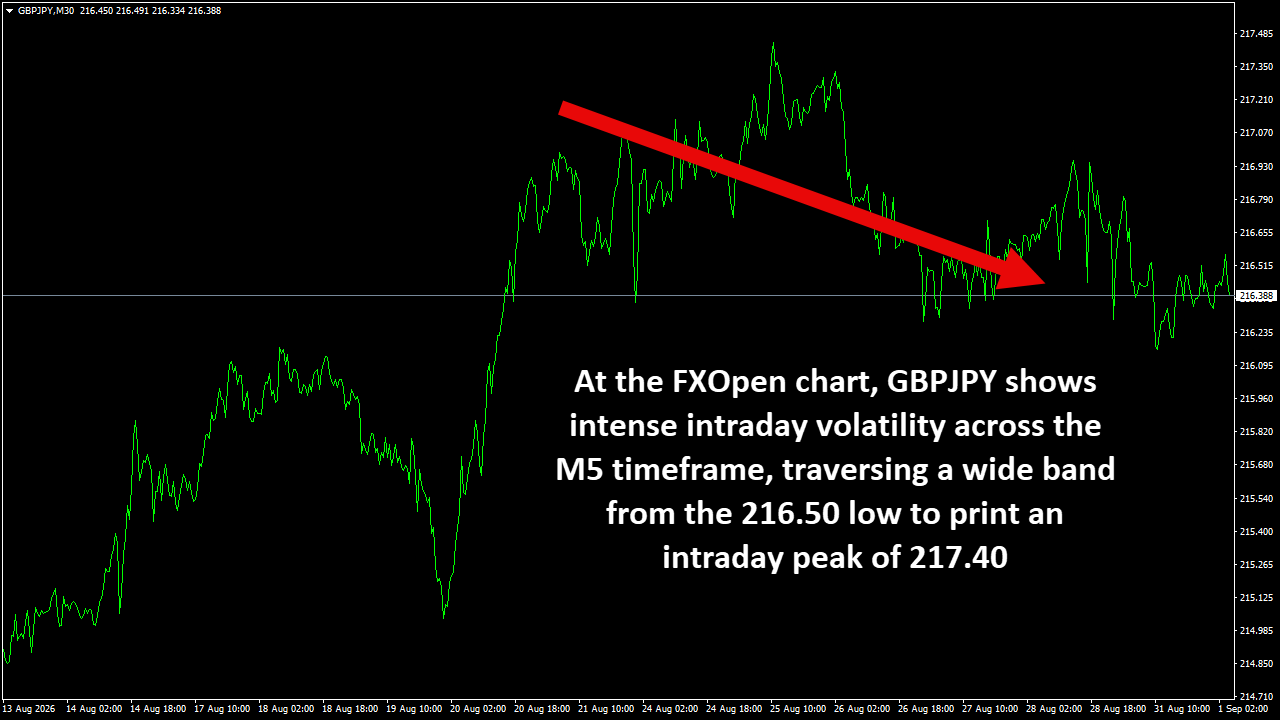
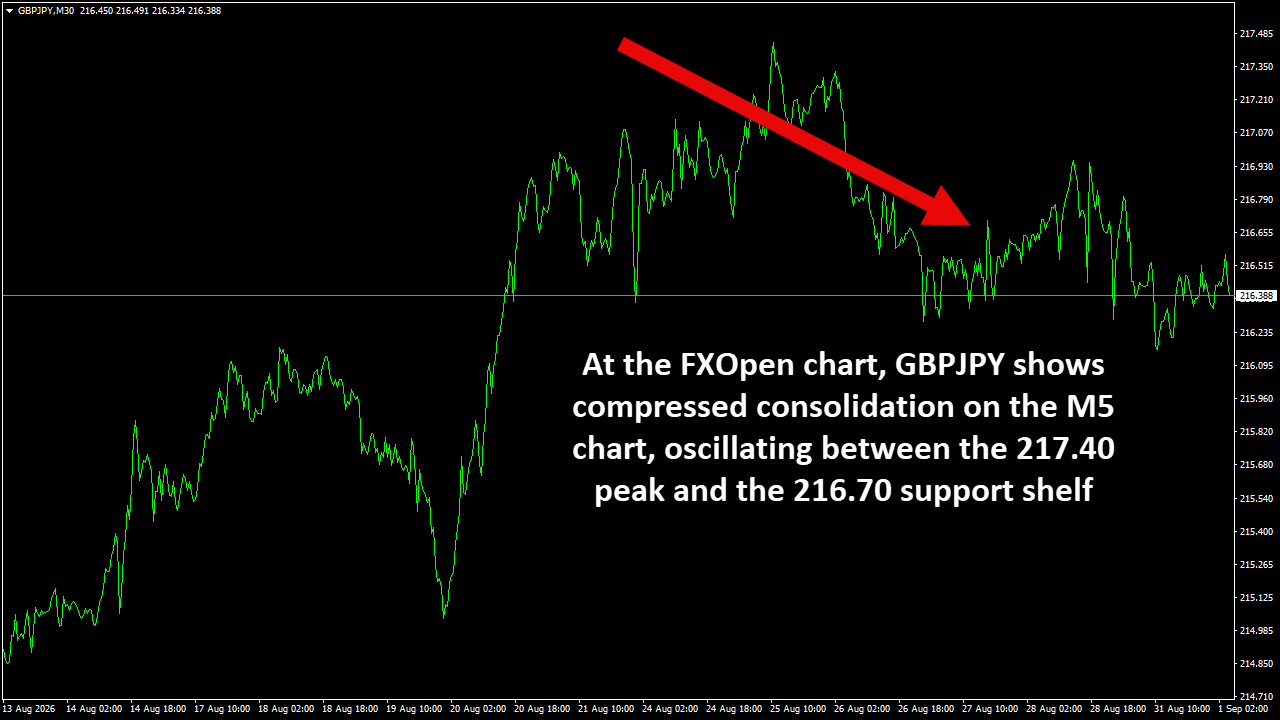
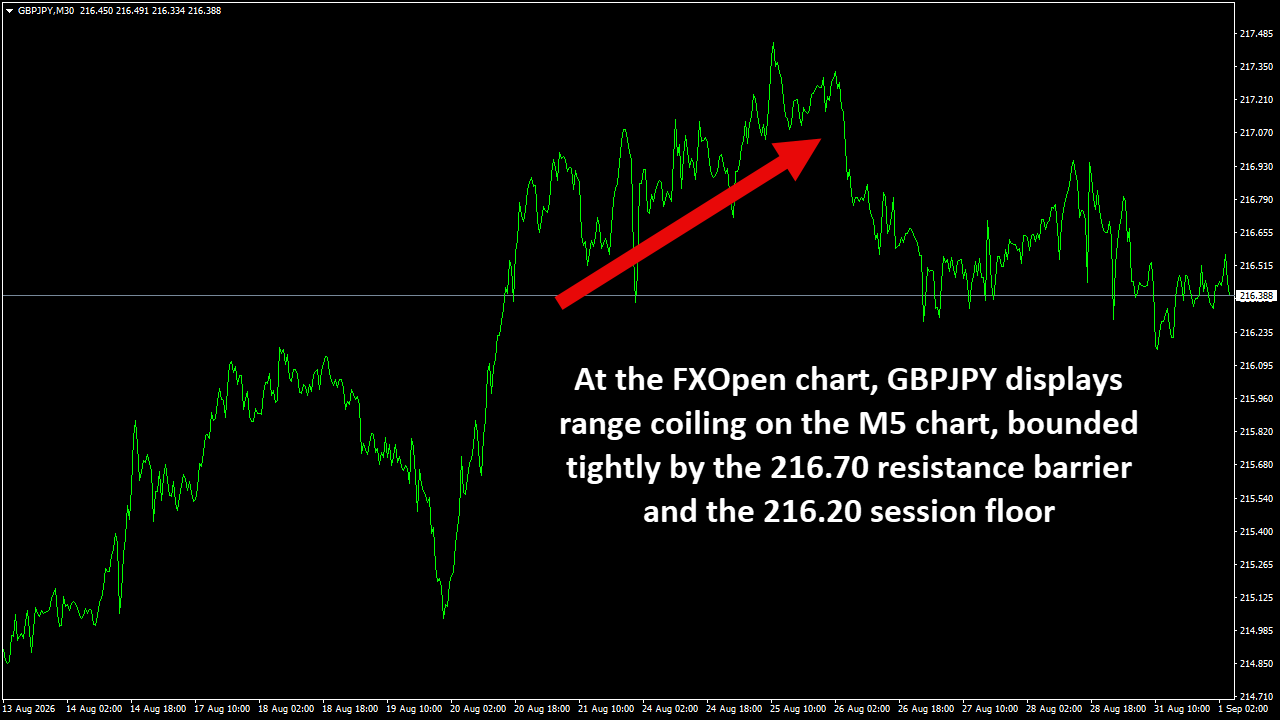
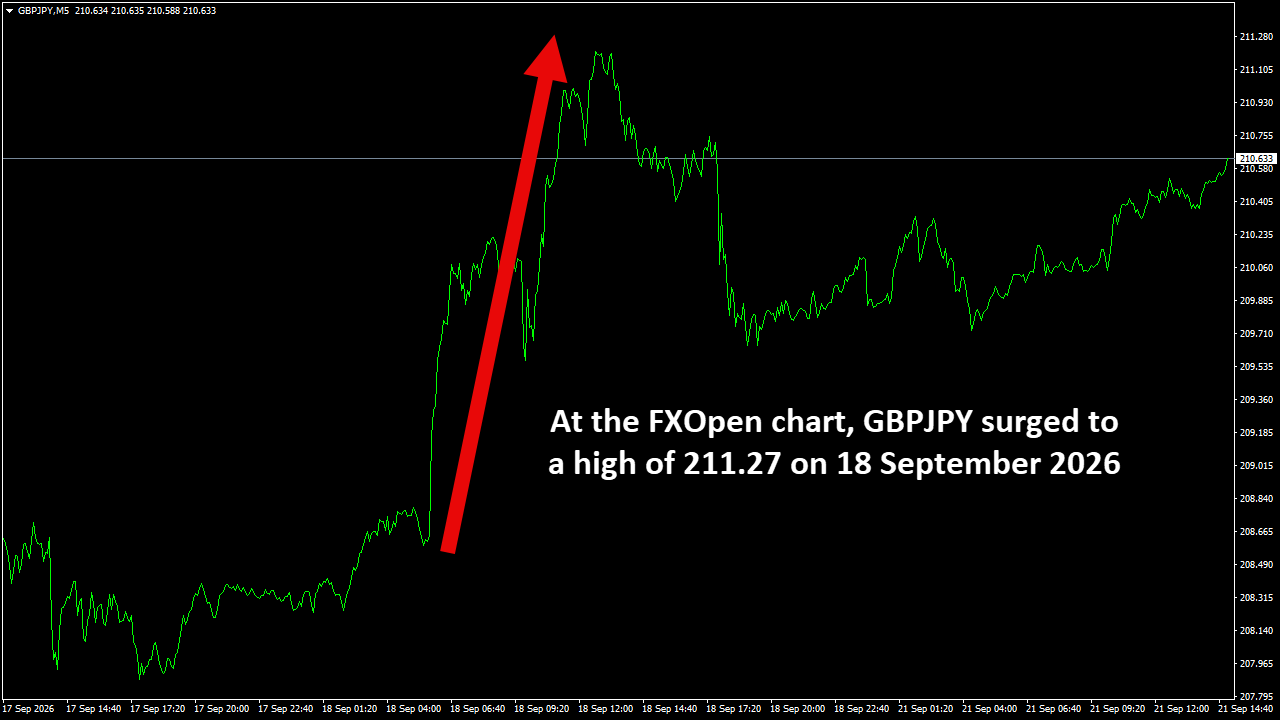
GBPJPY – At the FXOpen chart, GBPJPY displays range coiling on the M5 chart, bounded tightly by the 216.90 swing high and the 216.15 session floor
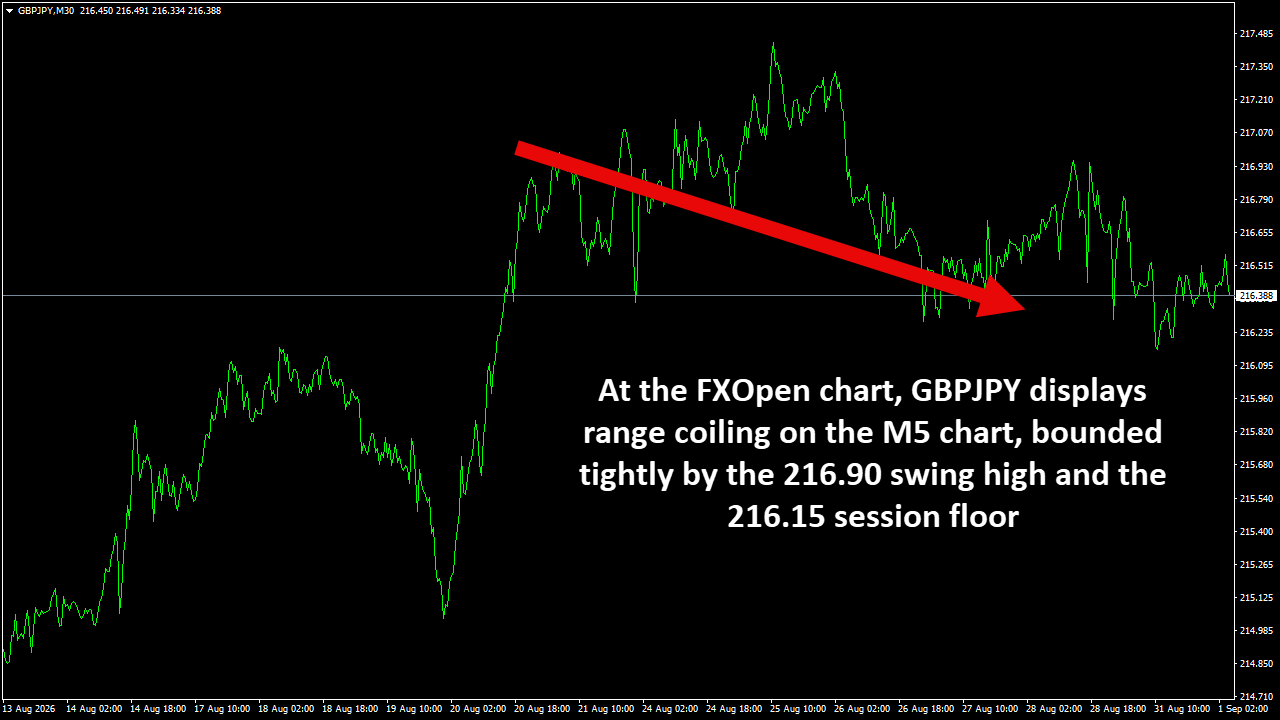
GBPJPY – High: 216.90 | Low: 216.15 – Date 23 Aug 2026
At the FXOpen chart, GBPJPY displays range coiling on the M5 chart, bounded tightly by the 216.90 swing high and the 216.15 session floor. Price action is establishing an intraday equilibrium base near 216.50, respecting support along the 50-period moving average. The stochastic oscillator signals mild accumulation near the lower quadrant without generating momentum divergence. An M5 breakout above 216.90 activates a rally toward the 217.40 resistance level, while a break beneath the 216.15 support shelf triggers an intraday shift toward 215.60.
#fxopen #forex #forexanalysis
Disclaimer: This analysis represents my own opinion only. It is not to be construed as an opinion, offer, solicitation, recommendation, or financial advice of the Companies operating under the FXOpen brand.
AUDUSD – At the FXOpen chart, the M5 timeframe illustrates a tightly compressed consolidation channel following the preceding rejection near 0.7180
AUDUSD – High: 0.7170 | Low: 0.7145 – Date 23 Aug 2026
At the FXOpen chart, the M5 timeframe illustrates a tightly compressed consolidation channel following the preceding rejection near 0.7180. Price action is holding along a narrow shelf above the 0.7145 floor, while the descending 20-period EMA caps upside probes at 0.7170. Order flow shows low weekend session participation, with volume histograms heavily diminished. Oscillators remain flattened near the neutral midline. A sustained 5-minute close above 0.7170 unlocks momentum toward the 0.7195 liquidity shelf, whereas losing the 0.7145 baseline opens room for a sweep of sell-side liquidity down to the 0.7115 demand area.
#fxopen #forex #forexanalysis
Disclaimer: This analysis represents my own opinion only. It is not to be construed as an opinion, offer, solicitation, recommendation, or financial advice of the Companies operating under the FXOpen brand.
EURCHF Technical Analysis – 23Aug, 2026
EURCHF – At the FXOpen chart, EURCHF on the 5-minute chart exhibits subdued range behaviour between the 0.9360 ceiling and the 0.9335 support baseline
EURCHF – High: 0.9360 | Low: 0.9335 – Date 23 Aug 2026
At the FXOpen chart, EURCHF on the 5-minute chart exhibits subdued range behaviour between the 0.9360 ceiling and the 0.9335 support baseline. The pair continues to oscillate around the volume-weighted median of 0.9348, printing small candle bodies and compressed Bollinger Bands. The 20-period and 50-period EMAs remain tightly intertwined, indicating complete structural equilibrium. A decisive push through 0.9360 is required to attract momentum buyers toward 0.9385, whereas a break below the 0.9335 floor leaves the pair vulnerable to extended distribution toward the 0.9310 support zone.
#fxopen #forex #forexanalysis
Disclaimer: This analysis represents my own opinion only. It is not to be construed as an opinion, offer, solicitation, recommendation, or financial advice of the Companies operating under the FXOpen brand.
EURJPY Technical Analysis – 23 Aug, 2026
EURJPY – At the FXOpen chart, EURJPY on the M5 timeframe reflects tight horizontal compression between the 185.75 high and the 185.10 low
EURJPY – High: 185.75 | Low: 185.10 – Date 23 Aug 2026
At the FXOpen chart, EURJPY on the M5 timeframe reflects tight horizontal compression between the 185.75 high and the 185.10 low. Price action maintains a mild ascending base above 185.25, with buyers absorbing minor pullbacks into the 50-period EMA. The relative strength index hovers near 51, confirming a balanced order book ahead of the weekly open. A high-volume breach of 185.75 targets an immediate test of 186.10, while a breakdown below the 185.10 floor opens the pathway for a deeper corrective slide toward 184.50.
#fxopen #forex #forexanalysis
Disclaimer: This analysis represents my own opinion only. It is not to be construed as an opinion, offer, solicitation, recommendation, or financial advice of the Companies operating under the FXOpen brand.
EURUSD Technical Analysis – 23 Aug, 2026
EURUSD – At the FXOpen chart, the EURUSD 5-minute chart portrays a structured holding pattern following the late-week rejection at 1.1715, establishing support at 1.1660 and a local ceiling at 1.1695
EURUSD – High: 1.1695 | Low: 1.1660 – Date 23 Aug 2026
At the FXOpen chart, the EURUSD 5-minute chart portrays a structured holding pattern following the late-week rejection at 1.1715, establishing support at 1.1660 and a local ceiling at 1.1695. The pair trades in a narrow consolidation wedge, with the 20-period EMA providing dynamic resistance near 1.1680. The RSI has normalized to neutral levels, leaving room for expansion upon session breakout. A confirmed move above 1.1695 establishes bullish continuation toward 1.1725, whereas an M5 breakdown under 1.1660 risks an intraday corrective swing toward 1.1625.
#fxopen #forex #forexanalysis
Disclaimer: This analysis represents my own opinion only. It is not to be construed as an opinion, offer, solicitation, recommendation, or financial advice of the Companies operating under the FXOpen brand.
GBPJPY Technical Analysis – 23 Aug, 2026
GBPJPY – At the FXOpen chart, GBPJPY displays range coiling on the M5 chart, bounded tightly by the 216.90 swing high and the 216.15 session floor
GBPJPY – High: 216.90 | Low: 216.15 – Date 23 Aug 2026
At the FXOpen chart, GBPJPY displays range coiling on the M5 chart, bounded tightly by the 216.90 swing high and the 216.15 session floor. Price action is establishing an intraday equilibrium base near 216.50, respecting support along the 50-period moving average. The stochastic oscillator signals mild accumulation near the lower quadrant without generating momentum divergence. An M5 breakout above 216.90 activates a rally toward the 217.40 resistance level, while a break beneath the 216.15 support shelf triggers an intraday shift toward 215.60.
#fxopen #forex #forexanalysis
Disclaimer: This analysis represents my own opinion only. It is not to be construed as an opinion, offer, solicitation, recommendation, or financial advice of the Companies operating under the FXOpen brand.