chris kobewka, 60minute trader etc.

sashen said:
Thanks Edster... After an email or two from Chris, I wouldn't try spreadbetting, just trading the YM.

So are you, then, trading it on the YM? Is your win% like what Chris posts on the 60min site (37-3 since 1 April, I think... 75%+ overall)? If not, how do you account for the difference?

Thanks.

Working shifts and having family commitments I don't get to actually trade it very often but I've tried it a dozen or so times and have only 'lost' once (I'm only trading one or two contracts). That was mainly due to the fact that Sierra Charts' studies are a bit jerky. It could show you that the ADX has changed direction one second and then it goes back the other way again and the chart doesn't show you that it had changed in the first place. Supposedly BigCharts are better but you have to keep refreshing as it's not real-time updated. I haven't tried them yet though. Hope that helps.

Ed
 
Okay, I have read and traded this method. Those of you who have read the ludicrous claims and testimonials on the website and felt excited, think again. Trading via the indicators laid out in this book can be very subjective. The book gently recommends a 20 point stop. So if it claims to win 75 times out of 100, with a suggested profit target of 6 points then do the math. The method relies on volatile swings during the open of the market. You will learn from the ebook if you buy it, but it really is not worth the money. It's way too hyped up. A gateway to riches it definately isn't. Take a look down the library or check ebay. Don't be sucked in.
 
I would have to agree with Captain-Rick, this method is quite subjective. The advertising suggests that it is very easy to implement, but my experience is that it is difficult to match the trades that Chris takes. It also relies on the user defining how he/she will enter the trade (market, stop-limit). This is not defined in the book.

The trade on Friday looked different on my chart than the one posted in the results. In fact, I did not (and cannot on my charts) see the trade that Chris took - my trade occurred 10 minutes later (with a better return, of 7 points).

I have noticed that when backtesting, the indicators look slightly different than when they are forming.

It is a method that you could not make any money spreadbetting - with the spread and speed of execution it will not work. It requires a very fast execution to be successful.
 
The other thing that I have noticed is that Chris reports the results using BigCharts. The indicators used in BigCharts have fixed variable values for the indicators and in one case this is not the value that Chris uses in the book.
 
I have to say that I would not consider this ebook value for money. It has a lot of filler that is not relevant to the system and is interest only to a rookie (and which can be found in many other trading books). (From the advertising though, this book is also targeted at non-traders, so perhaps this is why some of this is included).

The system described has some interest and can be used for other ideas, but for the money you could buy "Street Smarts" which comes with a lot more ideas or "Master Swing Trader" which has even more (and you would end up with more change out of £100).

I have bought a few ebooks on trading and have been generally disappointed. It probably comes down to the motivation of the author. For books published by "regular" publishers the author writes because of interest in the subject (rather than trying to make money out of the book, which is difficult unless it becomes a best seller). On the other hand, publishing an ebook, the motivation appears to be to make a large amount of money (and hence is an exercise in marketing).
 
Last edited:
Thanks for all the feedback Ozzie, Edster and Captain-Rick... if anyone else has any experience, I'd still love to hear it... and, Chris, if you have any comments about what's been said, I'd REALLY love to hear that.
 
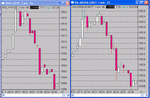
The two recommended charting packages in the book are SierraCharts and Bigcharts so if Ozzie is getting different signals this could be due to the charting package he is using.

Even between the two used, one day last week there was a 40 point difference near the open between SC and BC, which one was right? I like to wait untill they agree.

Different data sources can give different values, also if your computer clock is slightly out so will the candles and therefore the indicator readings.

This is why I use Bigcharts in the daily results because it comes from a single source on the net and everyone should see the same thing.

. The book gently recommends a 20 point stop. So if it claims to win 75 times out of 100, with a suggested profit target of 6 points then do the math.

Sorry it does not claim to win 75 times out of 100, it is much higher, that is our guarrantee.

What has the stop got to do withe the reward/risk ratio? If I have a 600 point stop which never gets hit and a 6 point target is this a R/R of 100:1?

No, the correct way to calculate is to divide your average winner by your average loser, which is totally different. A 17 point stop from the initial high/low has not been hit this year.

This does not mean that there have not been losers there have but the average loss for the year so far is just 3 points. A totally different calculation.

It is a well known fact that when giving any system to a group of traders there will be various results, this has nothing to do with subjectivity.

It has been found that newcomers outperform the more experienced trader, why? Simply because they just follow the rules whereas the trader may hesitate or change things to what he already knows.

I only use half of the points possible in the move in the daily results which over the long term is my average.
 
Chris & Others….

I feel that I’d like to make a few points.

Firstly, as an experienced trader I would like to say that I find some of the results which Chris posts on his site to be highly subjective. Chris – I feel that you need to be careful here. Are you really trading these signals in real time or do you just review the charts after the first 60 minutes and work out where perhaps you might of taken your trade?
I would have to agree with Ozzie with regard to Friday’s trade – On the website you show the trade on a chart which is marked ‘DJIA’. This is not a real market, it is a mathematically established index derived from the last traded price of each of the Dow 30 components. This means that you can not actually take a position on the ‘DJIA’ as the physical contract doesn’t really exist. The only way of taking a position is to use the Dow Futures (YM’s). If you compare Friday’s trade with a YM chart then the trade simply does not end in a profit. (The same is true of a spreadbetting quote as the quoted price is simply tied to the underlying futures market and not the derived index value). The problem with you trade on Friday relates to issues surrounding the opening of Dow 30 stocks. The Dow 30 uses what is known as a ‘rotational opening’. They don’t all open at the same time, they open is a predetermined order once the ‘specialist’ company order books reach some kind of balance. I think on Friday we had a situation where a couple of stocks hadn’t opened after the first 4 minutes of trading. The result was that the official DJIA Index was still being calculated using a number of prices which were based on the previous days closing level. This lead to the index showing a level slightly lower than was ‘real’. The index simply ‘popped’ back into line once all 30 stocks had traded. Unfortunately, on your website, you use this anomaly to suggest that a trading opportunity existed when, in reality, it didn’t – there was no instrument that you could buy which reflected the quoted level of the DJIA prior to all 30 stocks having traded, the YM’s had already priced in the correct level of the Dow based on all 30 stocks having traded. As I mentioned already, all prices quoted by the various spreadbetting companies would be tied to the YM’s even though they might be named ‘Dow Cash’ etc. I’m guessing that you didn’t actually trade your suggested trade on Friday?

Having studied you previous results I would suggest that you have little choice but to post the charts basis the YM’s and not DJIA which is, to all intents and purposes, a slightly lagging indicator as well as being untradable. The YM’s however show prices which were physically available to the market speculator at a given point in time and are therefore much more applicable to people who have (or might) buy the system because it is likely that these people are interested in really trading it rather than the hypothetical observations based on the DJIA.

To all intents and purposes I would suggest that the system does look an interesting one. I would however point out that it would be impossible to trade it via spreadbetting and the only method which can be used is direct access through a fast electronic broker such as IB. It’s hard to place a value on any given system – like the market itself, something is only worth what someone else is prepared to pay for it.

As for the system itself. Again I would agree with other buyers of the system. The actual trades are somewhat subjective. In the advert I recently saw it stated that the system told you ‘exactly’ when to trade – in simple terms it does not do that. What the system does is to alert you to a potential trade opportunity – this is not a ‘split second’ process and therefore is not mechanical. I felt, having read the advert, that the system was mechanical in nature and I feel that people maybe disappointed by this. The website does however offer a ‘no quibble’ money back guarantee if you are not happy so you would appear to be pretty safe. With anything like that I always buy with a high profile credit card just in case there is any ‘quibbling’ on the part of the vendor. The bigger card companies have legal departments with quite a lot of clout and therefore the online payment processors tend to bow to pressure if push comes to shove.

Looks like today’s trade looks like a bit of a wash out.

Hope this helps all concerned,
Steve.
 
As you know, I'm not here to defend Chris... I'm trying to see if his system is as mechanical as he says and if the trades he calls are legit and reproducible. I think it's been pointed out enough times that he doesn't recommend spreadbetting but, instead, trading the YM off of the setups that occur on an $INDU or DJIA chart.

I *can* see a way that you *possibly* got your 6 ticks on the YM in 4 min on Friday, but without knowing the actual setup, I can't tell if it was legit.

That said, it would be MUCH better if the results were posted with the YM since that's where the trades actually occur.
 
So, now the comical question is this:

Since 5/31 was a big losing day for the 60MT, and Chris posted the results showing that, do you feel better that the system is not a Holy Grail... or disappointed because it's not ? ;-)
 
stevespray

Are you really trading these signals in real time
I have posted the times of my entry and exit which were taken from the trades list on the InteractiveBrokers platform, so yes.

or do you just review the charts after the first 60 minutes and work out where perhaps you might of taken your trade?

A snapshot of the charts is taken just after the trade, it would look quite different after the first hour as the scale would probably be different.
Having studied you previous results I would suggest that you have little choice but to post the charts basis the YM’s and not DJIA which is, to all intents and purposes, a slightly lagging indicator as well as being untradable. The YM’s however show prices which were physically available to the market speculator at a given point in time and are therefore much more applicable to people who have (or might) buy the system because it is likely that these people are interested in really trading it rather than the hypothetical observations based on the DJIA.
I will have to disagree with that, part of the method is comparing both the cash and futures charts and only trading when they both agree. I have not found that there is too much difference between the two. As you can see below the peaks are within a minute of each other and from top to bottom the move is about 28 points on each.
attachment.php

To all intents and purposes I would suggest that the system does look an interesting one. I would however point out that it would be impossible to trade it via spreadbetting and the only method which can be used is direct access through a fast electronic broker such as IB.
Not impossible via spreadbetting but much better and easier via futures.
The website does however offer a ‘no quibble’ money back guarantee if you are not happy so you would appear to be pretty safe.
The guarrantee is that is wins 75 times out of 100.
Looks like today’s trade looks like a bit of a wash out.
It certainly was, as posted.

I am a bit concerned as to why you did not get the first signal, can you send me a snapshot of your charts for the INDU and YM so that I can compare, I think I know what it could be.
[email protected]
 

Attachments

  • inym.gif
    inym.gif
    23.1 KB · Views: 1,000
Interesting to compare your charts to TradeStation -- the YM matches perfectly... the INDU doesn't
 
Chris, My concern is this, yesterdays trade (31/05) was again posted on a DJIA based chart. This is of no real use. According to your DJIA chart you lost around 10 points. The reality was that the hard stop of 17 points was hit if you traded any instrument linked to the YM's. My point is this, potential customers might think that your loss was only 10 points when in reality it was actually 17. You also state that the trade lasted for 24 minutes - this appears to break the trading rules which you lay out in your system instructions. Using the YM's I see a buy signal at 10,515 ish which would have been stopped out automatically when we traded at 10,498..this occured about 8 or 9 minutes later. I acknowledge that this may not be reflected in the DJIA chart simply because the DJIA is not calculated on a tick by tick basis but at time intervals. The futures, to which all tradable instruments are attached, move in a more extreme fashion than the DJIA - the net result is that the peaks / troughs tend to be higher / lower. In the example you posted for 31/05 you show a stop after a recovery back up to 10,500. In the real world your stop would have been triggered for a loss of 17 on that dip that occurs (shown on the DJIA as a dip to 10,494 ish) which was lower on the YM's.

Steve.
 
Chris, How about simply posting snapshots of the daily trade on both YM and DJIA charts? Surely this would help new traders and clarify any differences which are inevitable, what possible reason would there be not to do this, if of course you feel obliged to help people out who are following your style. I personally had little confidence in using a subjective, discretionary system. It did introduce me to a fast electronic broker, front end software and charting package though. What beginners really need is military style rules, being vague just puts people in hope mode and elevates the emotional factors. (I'm assuming the book is marketed at newbie traders) stevespray has offered some very constructive critisism on his postings I have to say.
 
sashen
the YM matches perfectly... the INDU doesn't
In what way does it not match? There is still about 28 points from top to bottom an my TS chart.
attachment.php

The reality was that the hard stop of 17 points was hit if you traded any instrument linked to the YM's
Stevespray
Please read post 87, I place my stop 17 points from the high or low. In this case the low which was 10512 on both Sierracharts and Tradestation. This is the same as a 20 point stop as captain nick mentioned from entry and was 10495. The lowest low on both Tradestation and Sierracharts for the first 45 minutes was 10496. Do you get different? What charting package are you using?
 

Attachments

  • induTS.gif
    induTS.gif
    11.9 KB · Views: 967
Chris, I was commenting on exactly what your 2 charts show... same high/low... very different bars in between.
 
same high/low... very different bars in between.

As I have previously said this can vary on ones computer clock, I think TS uses its server time.

Others seemed to be saying that there was a difference in the movement between the cash and futures, in general I would say that the futures are slightly more volatile and by showing the moves on the cash I am being conservative.

Today for example there was a 14pt move (low to high) on the cash but 18pts on the futures.
 
Stevespray
Please read post 87, I place my stop 17 points from the high or low. In this case the low which was 10512 on both Sierracharts and Tradestation. This is the same as a 20 point stop as captain nick mentioned from entry and was 10495. The lowest low on both Tradestation and Sierracharts for the first 45 minutes was 10496. Do you get different? What charting package are you using?

I traded this on YM on Friday and ended up with the result Stevespray mentions. The rules of the system state that the "absolute maximum stop-loss should be 17 points from your entry" (p53).

I am not sure what the stop from the high/low refers to - am I missing something Chris?
 
To be fair, I just realised that I should have closed out on the time stop rule, therefore I would have been down only 6pts (trading the YM futures).
 
Last edited:
Chris - Firstly, thanks for the continued feedback.

Going back to what you were saying re YM's on 31/05.

The problem which I have is this. (Being careful not to directly comment too much on what the system instructions are). In your book you state that the 'absolute maximum' stop loss is 17 points. I can not see where you mention this '17 from the high / low' business. If we take this 17 points as a hard stop then we can not place it from the low / high of the intial move but only from the point which we entered the trade (unless of course we perfectly pick the market turn which is quite rare). If we change our stop rules and do as you have said, ie place the stop from the low / high then we leave ourselves open to a potential loss which exceeds our absolute maximum permitted loss from one trade.

On the 31/05 I traded the YM's as a test. Obviously I only used 1 contract - I find this a step up from paper trading. My entry was actually a buy at 10,515 which I feel was a fairly reasonable execution given the prices during that time period. I then followed the system rules, as I do with all the systems which I have written myself, and placed the hard stop order on the IB platform. 10,515 minus 17 equals 10,498. This was then hit at more or less exactly 10.00am EST. As you pointed out, the market dropped to 10,496 easily triggering the stop order. In order for the stop order not to be triggered the initial buy would have had to have been at 10,512 or better. The only way to have achieved such a fill at the required time would have been through the use of a limit order + prayer that you will get filled whilst sitting on the offer - in other words fairly remote. As I mentioned already, my fill at 10,515 looks reasonable given the trading conditions.

Chris, My question would be this.....We need to be sure which set of rules we are following. A hard stop of 17 (which is indicated in the ebook) is not subjective in any way yet you are now saying that the 'hard stop' isnt really a hard stop. If you dont get a fill at the exact base/top of the initial move then your risk is always going to exceed 17. What can we do about this?

Also, what about the rule regarding the time a trade is open? (Again I dont want to mention something that I shouldnt). If you impliemented that rule then you would not have been in the trade for as long as your trade log shows?

I use Tradestation 8.2 with the charts all logged to 'exchange time' which in theory avoids any confussion.

Hope you can help,
Steve.

PS You really do need to change your demo charts on the website to YM's and not DJIA. DJIA is not a tradable instrument and posting those charts is, I feel, rather misleading.
 
Top