Charts by Gedigan

Gedigan

Junior member
Messages
19
Likes
4
Hi Everyone

I'd like to start off 2019 with my first ever Journal. Don’t get me wrong, I’ve got tons of saved homework and actual trade charts but I’ve never had a journal. A first for me. Lets see where this goes.

About me, I have a day job (const. superintendent) & day trade between projects. So anticipate some day trades & swing charts. I’ll try and keep this to setups as they happen, with follow up once the objective is reached or I’m proven wrong and exit. As time permits.

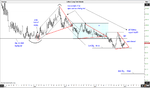
All charts will show Wyckoff as I understand the methodology. I hope, this helps me stay honest with myself, improve my reading of price action and entertain those who may drop in from time to time as i share my analysis.

Appreciate any feedback and constructive comments.

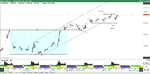
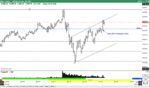
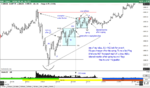
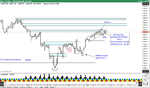
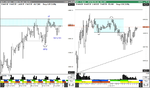
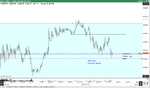
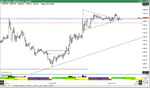
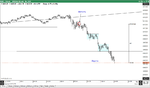
To start things off lets look at a 20 min. NQ.

Reading from left to right, I’ve labeled the chart with a red flag after a test of the 50% area. Price action was labored (over lapping bars), one would anticipate another selling bar (reaction bar) from this test. To me the ease of movement at this point was a COB (change of behavior). This behavior set up a spring condition. I've labeled PA from this point forward. One last comment, I have an objective of 6577.00 for this time frame, enjoy the chart, let's see how the day goes. :)


1-8   20 min..png
 
End of day recap.

As anticipated the Objective was reached with a decent reaction to the down side. This reaction gave us a spring with the market closing high end on a daily bar and recover the reaction after the objective was reached. I believe we are now in absorption under the 12/19 selling bar. With a spring in the background we should make further gains. a market with NO supply, Next objection 6692.50.
 

Attachments

  • 1-8 20 min #  6.png
    1-8 20 min # 6.png
    29.7 KB · Views: 253
Meetings today no trading.

Yesterday: 1/8 da good and da bad..

Again this is new to me, screen capture for a Journal. After a few morning trades where I didn’t save the chart I realized I need to get with the program.

I captured the 1st pic. showing my entry. It’s a late entry , actually I was looking at few currency and bond charts and missed the 50% retrace, thought the range would move more sideways. shame shame


chart 2, I’ve labeled my thought process at the time of this entry & covered 1/2 of the position at the RTL, moved stop just under entry. Luckily the spring didn’t trigger my stop. It’s here I look at ES noticed she was stronger than NQ and covered the 2nd half of my position as noted on the chart.
 

Attachments

  • 1-8   5 min.png
    1-8 5 min.png
    136 KB · Views: 253
  • 1-8   5 min #2.png
    1-8 5 min #2.png
    204.3 KB · Views: 263
An important area. A break here sets up a move to 5471.50

We closed mid range two bars ago a potential Lack Of Demand on a 4 hr. time frame.
Daily we are testing a weekly selling bar, on a retest they become a key area to watch.
Also a potential springboard set up. So we wait.... allow price action to work out next directional move.
 

Attachments

  • 1-10  4 hr..png
    1-10 4 hr..png
    203.1 KB · Views: 273
In my experience channel indicators tend to look great AFTER the event.By the time there is an obvious channel it is often close to ending and a reverse trade should be considered.
Hope this observation doesn't pour too much cold water on your method but...……..
 
In my experience channel indicators tend to look great AFTER the event.By the time there is an obvious channel it is often close to ending and a reverse trade should be considered.
Hope this observation doesn't pour too much cold water on your method but...……..


I don't have a hard time identifying channels, there just on overbought/oversold condition. Proper horz. lines are more important for obvious reasons. Actually the market doesn't care about our lines. It's a deep rabbit hole to address, but reading price action helps us discover who's in control, if we can loose our bias.

Yesterday the 4 hr indicated we had a lack of demand in the market. The Tokyo session gave us a UT after spring (bearish position) overnight. I didn't catch it on a 2 hr. chart until my pre-market analysis before US open. The Tokyo session setup the London break who took advantage of the lack of demand. Only to have the US session put a halt to the correction w/ buying tails. Unless theirs a COB I look for higher prices next week.
 

Attachments

  • 1-11  EOD.png
    1-11 EOD.png
    181.8 KB · Views: 271
Weekly Coffee's setting up for it's next leg down.
Interesting chart with a lot of activity.
 

Attachments

  • WK 1-12-19.png
    WK 1-12-19.png
    135.7 KB · Views: 285
What happened to peaceful warrior’s post. Seemed a good addition to me.
 
It became apparent I was hijacking someones thread, this was far from my intention. Wish Gedigan the best of luck

''if price was truth, volume keeps things honest''
 
It became apparent I was hijacking someones thread, this was far from my intention. Wish Gedigan the best of luck

''if price was truth, volume keeps things honest''

Oh, ok. I thought it was a very constructive follow on to Gedigan’s analysis and helpful to him (and others who are interested in the thread) in developing his methodology. The thread is the poorer for it’s absence.
 
Tuesday 1/15 ... overnight session

A market looking for demand, my entry & why I took the setup.
1. a 50% retrace.
2. test of a reaction bar
3. potential HH - HL
Will demand show up here?

Objective 6674.75
 

Attachments

  • 1-15 pre open review 4 hr..png
    1-15 pre open review 4 hr..png
    132.3 KB · Views: 258
  • 1-15 pre open review 20 min.png
    1-15 pre open review 20 min.png
    135.9 KB · Views: 284
  • 1-15 pre open review 5 min entry.png
    1-15 pre open review 5 min entry.png
    148.2 KB · Views: 273
Close of the last 20 min bar was below mid range. Time to cover, demand didn't enter, Never "HOPE". If a market doesn't act as anticipated get out!
 

Attachments

  • 1-15  covered my position.png
    1-15 covered my position.png
    132.7 KB · Views: 254
My "Achilles Heel" & one of the reasons I started this journal. I didn't sit tight & didn't re-enter at the lower level.
2nd entry with more "risk". same Obj.

Words of wisdom

Men who can be right and sit tight are uncommon. I found it one of the hardest things to learn.
Jesse Livermore

The market does not beat them. They beat themselves, because though they have brains they cannot sit tight.
Jesse Livermore
 

Attachments

  • 1-15 2nd entry.png
    1-15 2nd entry.png
    121.7 KB · Views: 250
Obj reached position covered
going for a walk...
 

Attachments

  • 1-15 2nd entry & exit.png
    1-15 2nd entry & exit.png
    106.8 KB · Views: 243
no trades yesterday, I was out of town.

NQ setup... an apex breakout & retest, no hard obj. we may need to absorb the area marked here on the 2nd chart
 

Attachments

  • 1-18 am entry.png
    1-18 am entry.png
    129.7 KB · Views: 243
  • 1-18 am review & prep.png
    1-18 am review & prep.png
    175.4 KB · Views: 245
I covered the position
It's Friday I believe the CM took weekly profits
 

Attachments

  • 1-18 exit.png
    1-18 exit.png
    98.4 KB · Views: 266
Time to watch price action & loose my bias, go back and review background
my 4 hr chart is ok I'm not in sync with lower time frames
 
Last edited:
After spending the last few day's working on my mental frame of mind. Knowing I had to change and could improve. Today shows that time was well spent.
 

Attachments

  • 1-22 entry.png
    1-22 entry.png
    127.6 KB · Views: 255
  • 1-22 obj reached.png
    1-22 obj reached.png
    109.8 KB · Views: 257
Top