Me again, boy are you guys going to be busy :cheesy:
This is something I've been pondering for a while. I've seen some posts that imply if you are not careful you are in danger of getting your interpretation to fit with your wishes, or, put another way, you see what you want. This seems quite reasonable but I suspect is a little tricky to totally avoid for the inexperienced, such as me, especially when it comes to technical analysis, which the consensus is as much 'art' as 'science'.
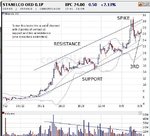
To the point. Take SEO chart one. On the data available to EOD 2/6 I can draw what I think is a legitimate channel. If these support/resistance lines are carried forward two weeks it gives us a range in the 33/25 area.
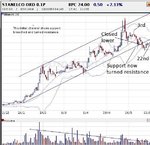
However in chart 2 you can see that 3 days latter support was breached and 3 days after that it closed below support. Support now becomes resistance.
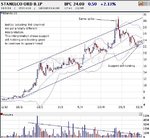
But with the additional data on chart 3 I can get a totally different interpretation with a slightly different channel. Now support is holding and it 'may' climb back up to test resistance. Projecting these lines forward gives us an area of 26/34, not to dissimilar from above. So which is 'right' or are they both 'right'. I am inclined towards the second channel as this more closely follows the Bollingers.
Incidentalley the divergence on volume, significant? (Please no flames 😉 )
Anybody willing to set me straight?
Cheers, tightone.


