Just a mere decade ago, most investors had to depend heavily on the Wall Street "professionals". Research and technical investment information was difficult to access other than through the brokerage firms. Fortunately, the advent of internet investing has completely altered the limitations that most investors had to overcome; getting information to do their own analysis.
The past decade has witnessed tremendous advances in the utilization of computer generated technical analysis. The average investor now has the capability to create any investment trading program that they can imagine. The abilities of computers have been able to greatly enhance the performance of successful investment methods. The candlestick trading method has been a great benefactor of the computer programming.
Candlestick Analysis
Candlestick signals, a trading method that has worked successfully for the past few centuries, is now being augmented by the application of techniques that could not have been considered just fifteen years ago. Correct trade ratios can be greatly increased by combining the historically tested Candlestick signals with statistically enhancing trend reversal data of today.
Candlestick trading has only recently been introduced into the U.S. investment community. Prior to the early80s, the usage of candlestick analysis was too complicated and labor intensive for the majority of investors. Computers simplified Candlestick charting. Candlestick charts are now a common alternative on most charting programs. Interest in how to evaluate candlestick signals has started to grow dramatically. The basis of Candlestick signals is that they are formed using "common sense" investment processes. The fact that the signals are around today is affirmation that they work. A "given" in investing is that if something doesn't work, it does not stay around very long.
Learning how to use the signals profitably has been considerably simplified over the past few years. Of the 50 or 60 candlestick signals, only ten signals have been identified as signals worth spending mental time and energy learning.? These ten "major signals" will produce more successful trades than most investors require.
Learning the major signals, whether day trading the E-Minis or investing for the long term, will greatly magnify your profit potential. Using the signals on their own produces high probability, high profit results. The main function of the signals is that they put the probabilities of being in the correct trade greatly in the candlestick investor's favor. They work a high percentage of the time when observed in the proper positions of a trend. The reason for their success is simple. These signals are the result of hundreds of years of rice-traders observations and actual trading results.
Improving on Candles
The success ratio of candlestick signals are now being further improved. Through many years of statistical research applying important moving averages to price trends has revealed some very important results. The research has altered the application of the moving averages. The common usage of the moving averages have been buying and selling of positions when specific moving averages cross through each other. Such as when the 10 day crosses the 20 day, or the 50 day moves through the 100 day, etc.
A more profitable application has been developed using the moving averages. Extensive research has identified moving averages that produce a high probability trading format. There are many moving averages that technical analysts consider important, ranging from the 3 day to the 1000 day. However, the research produced is that the important moving averages are the 50 day and the 200 day - important in the aspect of not waiting for the averages to cross each other, but that they act as support and resistance levels. These moving averages reveal impressive results indicating that trends bounce off the 50 day and 200 day moving average with considerably more regularity than any of the other moving averages.
When statistical analysis discloses a pattern that exhibits consistent regularity, it is usually a function of repeated human nature. As seen with stochastics, Elliott Waves, Fibonacci numbers and trend lines, human nature repeats the same sentiment patterns. Otherwise these technical systems would not have ever been identified. The findings become a valuable tool for projecting where a trend will meet a high probability resistance or support level.
Candlestick signals work very effectively on the basis of identifying a candlestick buy signal when stochastics are in the oversold area. The effectiveness becomes more enhanced when the moving averages are added to the analysis. A Candlestick buy signal, with stochastics in the oversold area, AND occurring at the 50 or 200 day moving average makes for a very strong buy point.
One of the basic results discovered in the research is when a trend breaches a moving average, comes back to test it and fails, it will test the next moving average and/or breach the recent lows of the current trend. Note the signals in the ENI chart. The signals occur very close to the moving averages, the 50 day and 200 day. Point A illustrates a spinning top, a long legged doji, and a couple days later a harami that was confirmed with a gap down in trading the next day. All these indecision and bearish signals were occurring right at the 50 day moving average.
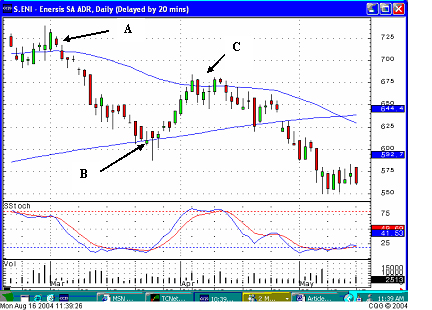
The candlestick signals revealed a failure of the trend to move up through the 50 day moving average. From that point, the trend moves down to the 200 day moving average. Notice that prior to Point B, the stochastics had moved into the oversold area. However, it was the appearance of the Candlestick buy signals right at the 200 day moving average that produced the trend reversal. The appearance of the Inverted Hammer signal and two Hammer signals was the clear indication that they were not able to keep prices down below the 200 day moving average. The gap up following those signals visibly indicated that the bottom had been established at the level. Then the trend moved right back up to the 50 day moving average. At Point C, the uptrend stopped right at the 50 day moving average again with the formation of a Bearish Engulfing signal. A few days later, after one more attempt to get up through the 50 day MA, a Morning Star signal, and double top confirmed the selling pressure again right at the 50 day MA. From that area, the prices when down and breached the recent lows.
For the swing trader, the signals, in combination with the moving averages create highly accurate trades lasting 3 to 15 trading days. For the longer term investor, the analysis can be applied to the indices. Having a platform for establishing long and short positioning greatly enhances the profit probabilities. Common sense portfolio strategies can be put in place by evaluating the direction of the market indexes and then scanning for the signals in individual sectors/stocks that correlate with the index trends. The moving averages provide the support and resistance levels while the Candlestick signals confirm what is happening to investor sentiment at those levels.
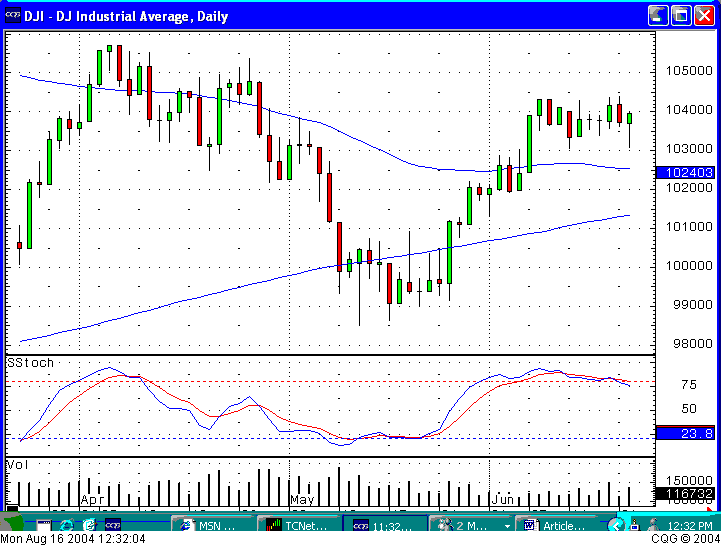
Note how the trading becomes indecisive in the moving average area on the Dow chart. These periods reveal numerous candlestick signals while the stochastics are in the oversold or overbought conditions.
A major advantage of combining candlestick signal confirmation with the moving averages is intra-day trading. When fast, decisive trade decisions are required to maximize trade potentials, the combination of the signals at the moving averages perform very well on the one minute, five minute and fifteen minute charts.
An inordinate number of trades can be executed every day when all the parameters align. As illustrated in the S&P one minute chart, candlestick signals will often be seen in the close proximity of the moving averages. Double top intra-day patterns are doubly strong signals when the price fails the 50 SMA average for the 30 minute and the 60 minute. Most often prices initiate strong trend moves from intra-day support, or resistance moves involving the 50 or 200 SMA bar averages.
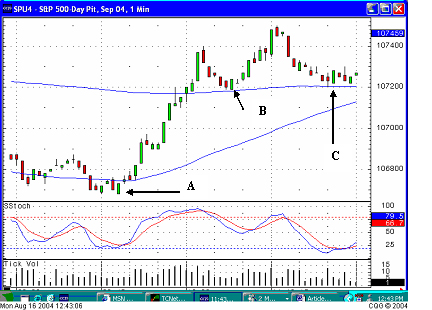
Point A illustrates a Bullish Engulfing signal followed three minutes later by a Piercing signal, occurring in the oversold area of the stochastics, and at the 50 minute moving average. Point B demonstrates a bullish engulfing signal as the prices pullback to the 200 minute moving average. Point C reveals a spinning top followed by a bullish engulfing signal again bouncing up from the 200 minute moving average. Having this visual trading format allows the day-trader, whether trading futures or commodities, to pin point the high probability turns in a trend.
Conclusion
Putting the probabilities in your favor is the basic premise for investing. Understanding where a trend has a high probability of reversing, then being able to see signals that confirm that the reversal IS occurring at that level, provides a high degree of accuracy to trading programs. Becoming educated in these easy-to-see visual techniques does not take a great amount of effort. Understanding the investment psychology behind the formation of the ten major candlestick signals will create the insights to success evaluation of price reversals. Knowing what moving averages are the effects of human nature support and resistant levels produce high potential targets.
Eliminate the dependency on the mediocre advise of the so-called "Wall Street Professional". Put your investment future in the hands of the most interested participant concerned about your portfolio and trading success- YOU.
The past decade has witnessed tremendous advances in the utilization of computer generated technical analysis. The average investor now has the capability to create any investment trading program that they can imagine. The abilities of computers have been able to greatly enhance the performance of successful investment methods. The candlestick trading method has been a great benefactor of the computer programming.
Candlestick Analysis
Candlestick signals, a trading method that has worked successfully for the past few centuries, is now being augmented by the application of techniques that could not have been considered just fifteen years ago. Correct trade ratios can be greatly increased by combining the historically tested Candlestick signals with statistically enhancing trend reversal data of today.
Candlestick trading has only recently been introduced into the U.S. investment community. Prior to the early80s, the usage of candlestick analysis was too complicated and labor intensive for the majority of investors. Computers simplified Candlestick charting. Candlestick charts are now a common alternative on most charting programs. Interest in how to evaluate candlestick signals has started to grow dramatically. The basis of Candlestick signals is that they are formed using "common sense" investment processes. The fact that the signals are around today is affirmation that they work. A "given" in investing is that if something doesn't work, it does not stay around very long.
Learning how to use the signals profitably has been considerably simplified over the past few years. Of the 50 or 60 candlestick signals, only ten signals have been identified as signals worth spending mental time and energy learning.? These ten "major signals" will produce more successful trades than most investors require.
Learning the major signals, whether day trading the E-Minis or investing for the long term, will greatly magnify your profit potential. Using the signals on their own produces high probability, high profit results. The main function of the signals is that they put the probabilities of being in the correct trade greatly in the candlestick investor's favor. They work a high percentage of the time when observed in the proper positions of a trend. The reason for their success is simple. These signals are the result of hundreds of years of rice-traders observations and actual trading results.
Improving on Candles
The success ratio of candlestick signals are now being further improved. Through many years of statistical research applying important moving averages to price trends has revealed some very important results. The research has altered the application of the moving averages. The common usage of the moving averages have been buying and selling of positions when specific moving averages cross through each other. Such as when the 10 day crosses the 20 day, or the 50 day moves through the 100 day, etc.
A more profitable application has been developed using the moving averages. Extensive research has identified moving averages that produce a high probability trading format. There are many moving averages that technical analysts consider important, ranging from the 3 day to the 1000 day. However, the research produced is that the important moving averages are the 50 day and the 200 day - important in the aspect of not waiting for the averages to cross each other, but that they act as support and resistance levels. These moving averages reveal impressive results indicating that trends bounce off the 50 day and 200 day moving average with considerably more regularity than any of the other moving averages.
When statistical analysis discloses a pattern that exhibits consistent regularity, it is usually a function of repeated human nature. As seen with stochastics, Elliott Waves, Fibonacci numbers and trend lines, human nature repeats the same sentiment patterns. Otherwise these technical systems would not have ever been identified. The findings become a valuable tool for projecting where a trend will meet a high probability resistance or support level.
Candlestick signals work very effectively on the basis of identifying a candlestick buy signal when stochastics are in the oversold area. The effectiveness becomes more enhanced when the moving averages are added to the analysis. A Candlestick buy signal, with stochastics in the oversold area, AND occurring at the 50 or 200 day moving average makes for a very strong buy point.
One of the basic results discovered in the research is when a trend breaches a moving average, comes back to test it and fails, it will test the next moving average and/or breach the recent lows of the current trend. Note the signals in the ENI chart. The signals occur very close to the moving averages, the 50 day and 200 day. Point A illustrates a spinning top, a long legged doji, and a couple days later a harami that was confirmed with a gap down in trading the next day. All these indecision and bearish signals were occurring right at the 50 day moving average.
The candlestick signals revealed a failure of the trend to move up through the 50 day moving average. From that point, the trend moves down to the 200 day moving average. Notice that prior to Point B, the stochastics had moved into the oversold area. However, it was the appearance of the Candlestick buy signals right at the 200 day moving average that produced the trend reversal. The appearance of the Inverted Hammer signal and two Hammer signals was the clear indication that they were not able to keep prices down below the 200 day moving average. The gap up following those signals visibly indicated that the bottom had been established at the level. Then the trend moved right back up to the 50 day moving average. At Point C, the uptrend stopped right at the 50 day moving average again with the formation of a Bearish Engulfing signal. A few days later, after one more attempt to get up through the 50 day MA, a Morning Star signal, and double top confirmed the selling pressure again right at the 50 day MA. From that area, the prices when down and breached the recent lows.
For the swing trader, the signals, in combination with the moving averages create highly accurate trades lasting 3 to 15 trading days. For the longer term investor, the analysis can be applied to the indices. Having a platform for establishing long and short positioning greatly enhances the profit probabilities. Common sense portfolio strategies can be put in place by evaluating the direction of the market indexes and then scanning for the signals in individual sectors/stocks that correlate with the index trends. The moving averages provide the support and resistance levels while the Candlestick signals confirm what is happening to investor sentiment at those levels.
Note how the trading becomes indecisive in the moving average area on the Dow chart. These periods reveal numerous candlestick signals while the stochastics are in the oversold or overbought conditions.
A major advantage of combining candlestick signal confirmation with the moving averages is intra-day trading. When fast, decisive trade decisions are required to maximize trade potentials, the combination of the signals at the moving averages perform very well on the one minute, five minute and fifteen minute charts.
An inordinate number of trades can be executed every day when all the parameters align. As illustrated in the S&P one minute chart, candlestick signals will often be seen in the close proximity of the moving averages. Double top intra-day patterns are doubly strong signals when the price fails the 50 SMA average for the 30 minute and the 60 minute. Most often prices initiate strong trend moves from intra-day support, or resistance moves involving the 50 or 200 SMA bar averages.
Point A illustrates a Bullish Engulfing signal followed three minutes later by a Piercing signal, occurring in the oversold area of the stochastics, and at the 50 minute moving average. Point B demonstrates a bullish engulfing signal as the prices pullback to the 200 minute moving average. Point C reveals a spinning top followed by a bullish engulfing signal again bouncing up from the 200 minute moving average. Having this visual trading format allows the day-trader, whether trading futures or commodities, to pin point the high probability turns in a trend.
Conclusion
Putting the probabilities in your favor is the basic premise for investing. Understanding where a trend has a high probability of reversing, then being able to see signals that confirm that the reversal IS occurring at that level, provides a high degree of accuracy to trading programs. Becoming educated in these easy-to-see visual techniques does not take a great amount of effort. Understanding the investment psychology behind the formation of the ten major candlestick signals will create the insights to success evaluation of price reversals. Knowing what moving averages are the effects of human nature support and resistant levels produce high potential targets.
Eliminate the dependency on the mediocre advise of the so-called "Wall Street Professional". Put your investment future in the hands of the most interested participant concerned about your portfolio and trading success- YOU.
Last edited by a moderator: