As is the case with other markets such as commodities, forex demonstrates patterns of "seasonal" behavior which can be traded. These calendar patterns vary from pair to pair due to the dynamics of the currencies involved. In this article, the Yen (JPY) is the focal point, though there are similar patterns of action in other ares of the foreign exchange market.
Monthly Patterns
If one first takes a look at the market from a monthly perspective, it can be seen that USD/JPY and the JPY-based crosses have months in which they demonstrate clear tendencies. The figures below outline this. The graphs takesa month-by-month look at USD/JPY since 1999 (seven years total), which encapsulates the time since the launch of the Euro, an important watershed moment in the forex market. Each bar indicates the net up month to down month reading. For example, a reading of +5 indicates that there were 6 up years for that month as opposed to just one down year, out of the seven

caption: Figure 1. USD/JPY Monthly Trading Patterns Source: Opportunities in Forex Calendar Trading Patterns - Anduril Analytics
A quick look at the chart indicates that there are a few months in which USD/JPY has been strongly biased in one direction or the other. The prime example is August, the month in which the market has been down every year since 1999. During that time, USD/JPY fell for the month at least 137 pips each time around, with most of the declines coming in at better than 200 pips. The average has been 320 pips, which translates to a move of 2.80%.
January and July also jump out. They have both seen USD/JPY rise in six of the last seven years. The results for July, however, are fairly unexciting. The market's average rise has only bee about 35 pips, whereas the average increase for January has been nearly 200 pips.
In the case of EUR/JPY, as one might expect, August is a consistent down month, though there has been one up month since 1999. The average decline has been over 300 pips. November has been equally biased to the upside in terms of the 6:1 ratio, but the average rise is only 77 pips. The really interesting month, however, is December. The market rose every year from 2000 to 2004. Even though it fell in 2005, the cross has averaged a 350+ pip increase each year.
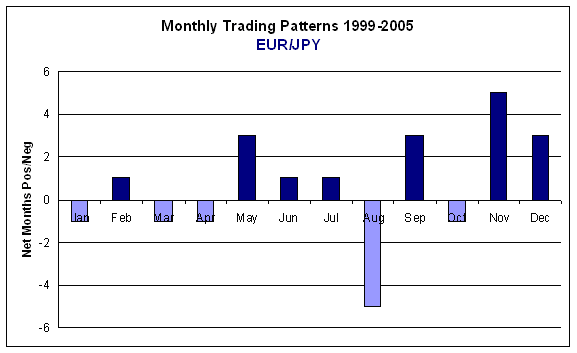
caption: Figure 2. EUR/JPY Monthly Trading Patterns Source: Opportunities in Forex Calendar Trading Patterns - Anduril Analytics
As with EUR/JPY, GBP/JPY shows very strong directional tendencies in August and December with an average drop of over 600 pips in August and an average gain of 435 pips to end the year. Sterling has an interesting tendency of its own in September, which is reflected in the cross with JPY for that month. Specifically, GBP/JPY has risen six out of seven years at an average rate of nearly 280 pips.
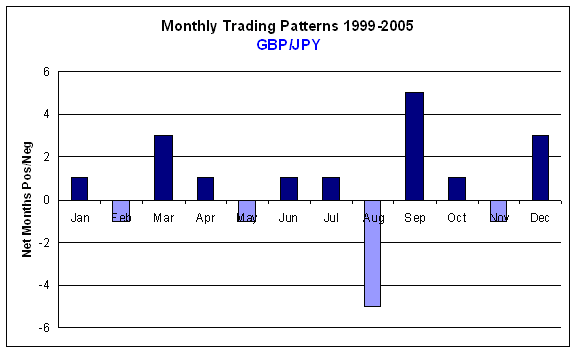
caption: Figure 1. GBP/JPY Monthly Trading Patterns Source: Opportunities in Forex Calendar Trading Patterns - Anduril Analytics
Weekday Patterns
Shifting from months down to days, we can see other patterns appear. Some of them are most obviously related to the monthly ones note previously. Others are less so. Again, the focus of the study is trading during the 1999 to 2005 span.
If one were to look strictly at the daily market movements, there would be very little to suggest that USD/JPY or any of the JPY-based crosses is anything other than a 50/50 directional prospect for any given weekday. Things get much more interesting when the filter of the month is applied as well. Take a look at the table below to see what kind of patterns show up.
Given that August has a strong downward tendency, it is no surprise to see that USD/JPY has three strong downwardly biased weekdays in that month. January, however, tends to be an up month for the market, but Monday's that month have a definite negative leaning. On the upside, there are examples of solid weekday biases scattered all over the place.
These sorts of weekday biases in certain months also can be seen in the crosses, in some cases in even stronger fashion.
Application to Trading
Trading based on seasonal or calendar patterns can be tricky. One can never quite be sure when a pattern is going to fail, or change all together. As a result, to blindly trade them with no concern as to risk would be quite foolish. Yes, some of these patterns are very strong. One who sold USD/JPY at the start of each August and closed out the trade at the end of the month would have made over 2200 pips in the last seven years. That's a pretty good take, but there are drawdowns. Sometimes they can be quite large.
Probably the best use of the type of data presented here is in its application to bias one's trading. For example, a day trader could make use of the fact that GBP/JPY has risen 75% of the time on Tuesday's in August to favor long positions on those days. A swing trader could look to sell strength or go with downside breaks in USD/JPY during August with a high degree of comfort that the percentages are in one's favor. And of course a mechanical trader can incorporate the calendar information in to systems.
The point is that data such as the calendar patterns outlined here should be considered another tool at one's disposal. It is potentially quite valuable, but certainly not an end in and of itself.
Monthly Patterns
If one first takes a look at the market from a monthly perspective, it can be seen that USD/JPY and the JPY-based crosses have months in which they demonstrate clear tendencies. The figures below outline this. The graphs takesa month-by-month look at USD/JPY since 1999 (seven years total), which encapsulates the time since the launch of the Euro, an important watershed moment in the forex market. Each bar indicates the net up month to down month reading. For example, a reading of +5 indicates that there were 6 up years for that month as opposed to just one down year, out of the seven
caption: Figure 1. USD/JPY Monthly Trading Patterns Source: Opportunities in Forex Calendar Trading Patterns - Anduril Analytics
A quick look at the chart indicates that there are a few months in which USD/JPY has been strongly biased in one direction or the other. The prime example is August, the month in which the market has been down every year since 1999. During that time, USD/JPY fell for the month at least 137 pips each time around, with most of the declines coming in at better than 200 pips. The average has been 320 pips, which translates to a move of 2.80%.
January and July also jump out. They have both seen USD/JPY rise in six of the last seven years. The results for July, however, are fairly unexciting. The market's average rise has only bee about 35 pips, whereas the average increase for January has been nearly 200 pips.
In the case of EUR/JPY, as one might expect, August is a consistent down month, though there has been one up month since 1999. The average decline has been over 300 pips. November has been equally biased to the upside in terms of the 6:1 ratio, but the average rise is only 77 pips. The really interesting month, however, is December. The market rose every year from 2000 to 2004. Even though it fell in 2005, the cross has averaged a 350+ pip increase each year.
caption: Figure 2. EUR/JPY Monthly Trading Patterns Source: Opportunities in Forex Calendar Trading Patterns - Anduril Analytics
As with EUR/JPY, GBP/JPY shows very strong directional tendencies in August and December with an average drop of over 600 pips in August and an average gain of 435 pips to end the year. Sterling has an interesting tendency of its own in September, which is reflected in the cross with JPY for that month. Specifically, GBP/JPY has risen six out of seven years at an average rate of nearly 280 pips.
caption: Figure 1. GBP/JPY Monthly Trading Patterns Source: Opportunities in Forex Calendar Trading Patterns - Anduril Analytics
Weekday Patterns
Shifting from months down to days, we can see other patterns appear. Some of them are most obviously related to the monthly ones note previously. Others are less so. Again, the focus of the study is trading during the 1999 to 2005 span.
If one were to look strictly at the daily market movements, there would be very little to suggest that USD/JPY or any of the JPY-based crosses is anything other than a 50/50 directional prospect for any given weekday. Things get much more interesting when the filter of the month is applied as well. Take a look at the table below to see what kind of patterns show up.
| Weekday | Month | Up😀own | Up/Down % | Avg. Pips | Avg. % |
| Tuesday | August | 9:22 | Down 71% | -27 | -0.23% |
| Thursday | August | 11:20 | Down 65% | -13 | -0.10% |
| Friday | August | 11:20 | Down 65% | -12 | -0.10% |
| Monday | January | 11:20 | Down 62% | -30 | -0.26% |
| Tuesday | May | 12:18 | Down 60% | -22 | -0.18% |
| Wednesday | November | 20:9 | Up 69% | 15 | 0.15% |
| Friday | September | 19:10 | Up 65% | 26 | 0.24% |
| Thursday | January | 19:10 | Up 65% | 20 | 0.18% |
| Wednesday | February | 18:10 | Up 64% | 33 | 0.30% |
| Tuesday | December | 18:11 | Up 62% | 15 | 0.13% |
These sorts of weekday biases in certain months also can be seen in the crosses, in some cases in even stronger fashion.
| Pair | Weekday | Month | Up😀own | Up/Down % | Avg. Pips | Avg. % |
| GBP/JPY | Tuesday | August | 8:24 | Down 75% | -52 | -0.28% |
| EUR/JPY | Monday | January | 8:21 | Down 72% | -33 | -0.30% |
| GBP/JPY | Friday | August | 9:22 | Down 71% | -31 | -0.17% |
| CHF/JPY | Monday | August | 9:21 | Down 70% | -15 | -0.18% |
| AUD/JPY | Monday | January | 9:20 | Down 69% | -16 | -0.22% |
| EUR/JPY | Wednesday | November | 22:7 | Up 76% | 34 | 0.29% |
| GBP/JPY | Thursday | October | 22:8 | Up 73% | 31 | 0.17% |
| AUD/JPY | Friday | September | 22:9 | Up 71% | 11 | 0.16% |
| EUR/JPY | Friday | June | 21:9 | Up 70% | 31 | 0.29% |
| GBP/JPY | Wednesday | November | 21:9 | Up 70% | 27 | 0.15% |
Trading based on seasonal or calendar patterns can be tricky. One can never quite be sure when a pattern is going to fail, or change all together. As a result, to blindly trade them with no concern as to risk would be quite foolish. Yes, some of these patterns are very strong. One who sold USD/JPY at the start of each August and closed out the trade at the end of the month would have made over 2200 pips in the last seven years. That's a pretty good take, but there are drawdowns. Sometimes they can be quite large.
Probably the best use of the type of data presented here is in its application to bias one's trading. For example, a day trader could make use of the fact that GBP/JPY has risen 75% of the time on Tuesday's in August to favor long positions on those days. A swing trader could look to sell strength or go with downside breaks in USD/JPY during August with a high degree of comfort that the percentages are in one's favor. And of course a mechanical trader can incorporate the calendar information in to systems.
The point is that data such as the calendar patterns outlined here should be considered another tool at one's disposal. It is potentially quite valuable, but certainly not an end in and of itself.
Last edited by a moderator: