The Baptist
Established member
- Messages
- 715
- Likes
- 45
Hi,
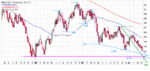
I have attached a weekly Chart of Cable (GBP/USD), with some basic Support & Resistance Analysis.
It is easy to forget that the first time Sterling closed above 1.92 (at a weekly level) for decades was just this past November the 24th, it did so on extreme volume with a similar follow through day on the next trading session.
The significance of this was that prior to this, a close above 1.92 had been repeatedly repelled as evidenced by my chart since November 2004. ( Marked with Olive arrows).
Interestingly This same level provided support around the 9th of March 2007. If Cable is underpinned as Robustly as resistance was provided at this level, it would be highly bullish.
I think the magic $2.00 mark is imminent, possibly soon with todays recent bullishness, this weeks Candle lays a far stronger platform for a break through than the January high repelled at the 1.99 level.
Could be a media frolic when this barrier falls, which may indeed be a time to sell/reverse into on a short term basis for swing traders.
I am biasing to medium term long. Further US Mortgage woes may come riding to the back of this one?
What do you Think?