Build Neural Network Indicator in MT4 using Neuroshell

Hi John,

I tried to verify your indicator compare to the price movement, it is difficult for me to get a clue how to use the indicator into a trading strategy. Some time the entropy function binary move as price but some time move in reverse.

Using entropy, we can bet that if entropy cross below zero for sell and cross above zero for buy.

Please advice If you have better way how to use entropy function binary indicator.

Thanks

You won't find any direct relationship with price. Instead you should be looking at entropy as an indication that the trend is going to change.
 
I apologize I did not check the link.
This is the site of John Conover:

NtropiX: Home

Subject: Stock Market

High Frequency is right. There is no correlation between the price direction and the the movement of the indicator.

The basic pattern the indicator gives is a drop of entropy. The idea is when there is a drop of entropy something is happening, something is going on.

Theoretically this can be used as a confirmation of a technical break - out. For example if the price goes beyond our break - out level and that is accompanied with a drop of entropy this is a kind of a filter that the break - out is good.

Here I add another derivative that is calculating the entropy surprise. This is from the thread on TSD (Digital ASCTrend) and Forex factory (Optimized trend trading) , but I wanted to share it everywhere.

I did on TSD to use the Kositsin library in order to use the Jurik smoothing of the entropy function. Really nice indicator.

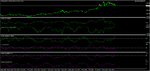
The other possibility is to use the entropy to adapt your directionnal algorythms. For example I used to adapt the SSA end-pointed normalized. I just devided the readings of the SSA by the entropy. So when the entropy is getting lower the readings will be bigger. So I had very big readings (oscillations when the entropy was small enough and smaller when the entropy is bigger.)

On the shot I show the difference between ssa normalized end pointed and ssa normalized end pointed with entropy adaptation (of course you can find other forms of adaptation, what I did is just a basic thing).

Here the surprise is -MathLog (P)); Bigger values equal more surprise. No idea how to trade.
 

Attachments

  • entropy patterns.gif
    entropy patterns.gif
    30.8 KB · Views: 869
  • Entropy function surprise.mq4
    1.8 KB · Views: 469
Last edited:
Thanks John and Highfreq for the explanation.

I believe we can use them as trading strategy inputs, such as:
- Buy when entropy cross above zero and entropysigma below a certain value
- Sell when entropy cross below zero and entropysigma below a certain value

In addition, I think we can make also some other variations of entropy equation.

John, please put the SSA indicator that you are using.

Thanks
 

Attachments

  • 3 Jentropy.png
    3 Jentropy.png
    45.3 KB · Views: 631
Here are the files. I upload all the necessary files. There is a dll file that goes to the folder experts/libraries (I mention this just in case).

The Entropy adaptive normalized SSA ep is also included this is the H mod. I put the entropy again because it is necessary in order to run the H mod as it reads from the entropy.

My projects are to include the SSA end - pointed as inputs in a learner. So far I used Trading Solutions and on a benchmark test the Use of the SSA end - pointed increased substantially the efficiency of the prediction compared to the close price only.

I also found a way to export files in CSV format in real time and to input them in Rapid Miner. This is my project.

However I would like to thank Krzysiaczek99 who gave me the link to here as he has uploaded the fxstrategy again (I find that great but unfortunately I am not a Matlab power user, not user at all to help).

However I am on another idea is to use adequate sampling. In fact I believe that the main problem is not the learner architecture but the market. The problem is that the market changes all the time. For example let take the example of the EUR/USD on the 1h chart. If you train the model from 15.08.11 to 20.09.11 you would input in the model the strange antipersitent characteristics of the summer range and those characteristics are not probable to repeat in the same way.

For me the most important thing is the sampling. Well I experimented in two ways: the Elliottware approach. This approach is to identify a specific repeatable pattern structure and to train the model to predict it. For example it is clear that from the beginning of September a new wave has begun. Well the ellioticians would try to put labels on that. My approach is to say hey we have a new structure let concentrate the model on it, so my model would be to use the number of bars from beginning of September. That is because I believe now the market action is repeatable withing the same pattern.

I used the BPNN predictor in order to do so, We made some mods using as input for example SSA ep. This predictor is not to be underestimated it uses Improved Resilient back-Propagation Plus (iRProp+). When I used the correct (according to the me LOL sampling it started to give very interesting predictions). The SSA is to simplify the series I do not want the Neural net to be fooled easily by some local optimum.


FXhackers: Elliotware: How it works?
 

Attachments

  • Entropy function binary.mq4
    1.8 KB · Views: 491
  • SSA normalized H.mq4
    3.1 KB · Views: 518
  • SSA normalized end-pointed.mq4
    3 KB · Views: 516
  • SSA end-pointed.mq4
    2.6 KB · Views: 507
  • picture adapt.gif
    picture adapt.gif
    31.1 KB · Views: 731
  • libSSA.zip
    34.5 KB · Views: 298
Last edited:
Here are the files. I upload all the necessary files. There is a dll file that goes to the folder experts/libraries (I mention this just in case).

The Entropy adaptive normalized SSA ep is also included this is the H mod.

does the indicator still do funny things when called from an EA?
 
I will be curious to know the results.
Here I add a provocative picture.

Neural net are performing at their best when the time series are with lower fractal dimension. But this concerns not only the neural net but also the impulse following algorithms.

Stop with discretionary trading. Join the machines.:p

Here we can see that the fractal dimension is low simultaneously on many different levels. For this kind of situation I made a hypothesis that a Low Phase Space Singularity exist.

The idea is to imagine that many adaptive algorithms are trying to find a solution. And the phase space of the possible solutions exist. So many of the machines are going to find the same solution and act accordingly.
In that case they would cooperate going in the same direction (robot psychology). The humans do not cooperate as much as machines do (human psychology).

Now imagine that all this machine thing happen not in our perceivable time but in the time of the milliseconds (high frequency). What would be the effect of this in our time?

If the humans form a nerd behavior the machines are making SUPER NERD behavior

-Increased probability of substantial market shocks
-Change in the market structure
 

Attachments

  • low fractal dim.gif
    low fractal dim.gif
    33.8 KB · Views: 805
  • low fractal dim15.gif
    low fractal dim15.gif
    33.2 KB · Views: 1,106
Last edited:
Seems I missed a lot of good stuff... Gladly this thread is still alive.

arryex aaNeuroMACD was working very very well. I think it needs to be retrained because it lost track after couple of days trading. But it shows how powerfull NN is :)
 
I apologize I did not see that the dll file was not uploaded for the SSA ep. I uploaded now uzing zip. You need to unzip it of course in the library folder.
 
As Highfreq pointed out,I think it is better not to use the entropy directly with the price.
I read the Noxa manual and this seems more logic:

---Take the mometum of entropy:
a) Low range of mometum of entropy usually indicates trend
b) High range of mometum of entropy usually indicates trading range
c) Extract standart deviation (even good old Bolli will do nicely) or set up certain threshold to find the extremes and determine them as breakout point and/ or use them along with RSI pivot levels fibo etc..This is my idea.


sy2mix.png
 
I found the SSA original code from codebase*mql4*com/ru/1413 - MQL4 Code Base

when translated from Russian to English, the author Klot, mention about this:
"Обратите внимание, что ССА перерисовывает свои значения в пределах
Lag баров! Поэтому применять её нужно осторожно."

means
"Please note that the SSA redraw their values ​​within Lag bars! Therefore, it should be used cautiously."

Anyone known how to clear out this issue for SSA? as I remember Noxa released CSSA to remove this problem, but I do not know how it works. Probably we can modify the SSA code..
 
Yes, the SSA is not a casual algorithm, it means that it uses all the data in order to make the computations. The new data when it comes is computed and as a result all changes. That makes the repainting over past date.

What you ask has been done.

What we have here is an end - pointed version. That means that we take the last computed data and we plot it. On the next bar we take the new data and we plot it. Behind the screen the SSA still recalculates (the current bar and everything behind) but as we plot the data bar per bar we have casual and non repainting readings. (This same approach has been used for Fast Fourrier Transforms by Meyers Analytics).

I asked guys to make this end - pointed version because it was logical to do it. As you can see it tracks cycles pretty well. I compared the SSA with the Noxa anlytics. And as a result for low number of computations the difference is not big. For higher number of computations above 6 the differences are bigger, because Noxa CSSA uses additional tricks.

I just wanted a free version of something like Noxa CSSA and that is how it was born. The first version was very slow, and then Mladen from TSD made a free and fast version that is the version currently available.

There is another difference from the CSSA. The difference is that in SSA ep you can plot only reconstructed series. In the CSSA you can plot what you want. For example when you have 5 number of computations in SSA ep, that means that you will have a recompositions of 1,2,3,4, and 5. In CSSA you can choose to plot only 2 and 3 for example.

I just want to mention that the SSA ep by smoothing the time series makes their job easier. In Traidng solutions tests it increased the predictability with 25 - 30 % over the benchmark using a Close price.
 
Last edited:
Just my two cents on entropy. I think the proper way to apply entropy is by figuring out when the market is in low entropy state (highly predictable) and catching the moment it is undergoing entropy increase and going back to random. The essence is practically the same in thermodynamic or information entropy. It is measuring probability info of an event to happen in the near future.

My personal fear of any system development is over doing things without having a fundamental understanding of what is it exactly that we are trying to do. In NN terms, this is garbage in garbage out. My hunch is somewhere along what Highfreq is hinting: model the cyclic behavior, work from the fact/data that it will go from one state to the other (Ornstein-Uhlenbeck), and exploit the probability in vector operations (magnitude & direction) coupled with probability derived/extrapolated from error-rate measurements and adjustments. The statistical processing engine (NN/SVM/etc) will only be a matter of personal flavor.

Hi,

What do you think about the eur/chf system, simple but effective when the right conditions are here.
 
What do you think about the eur/chf system, simple but effective when the right conditions are here.
I don't think I can contribute since think the condition is too specific (not robust). These days, I would run away immediately from any algorithm with parameters set in price axis unit (point/pip in fx).

After wasting years being ignorant, I learned that there are conditions when market tend to be asymmetrical exactly like there are moments you can cross any busy street more safely. I anticipate to enter at the approximate exhaustion distance going to the probabilistically/normally biased direction just when it starts reverting to normal. Why? Because that is what 'normal' means: how things should behave under most circumstance. Catch the abnormal, and the rest is normal. These states do not overlap. Think of venn diagram. Efficiency will come from timing the entry so the position would not be active longer than necessary.

Assuming the worst where the signal probability is random at best, the lognormal distribution of the output vector should ensure that MFE profile will be significantly larger than MAE profile even only at a portion of the CDF. Else, there would be no edge whatsoever so we can all give up and go home. Neither in probability nor reward/risk ratio. If you like to see more frequent wins, then you need to reduce the reward distance. Don't be surprised if it's just shifting equilibrium between reward/risk vs winning probability + sample variance. Example: 50% wins w/ 1:1 reward, 75% wins w/ 1:3, or 99% wins, 1:99. This is not yet accounting time horizon.

Just like in the EURCHF EA, setting stoploss distance magnitudes beyond the current trading range will also keep the stoploss probability low. This is valid up to certain timespan multiple of the chart timeframe bar. You have to ensure that within that timespan your target gets struck more often than when stoploss gets hit eventually (it should and it will).

Lots of ways to think about this and all requires proper accounting of dy(price) and dt(time) axis coupled with deductive way of thinking working our way from hypothesis down to how we plan to test it on our data. My apologies for derailing the thread from NN and so this will be my last post.
 
Just my two cents on entropy. I think the proper way to apply entropy is by figuring out when the market is in low entropy state (highly predictable) and catching the moment it is undergoing entropy increase and going back to random. The essence is practically the same in thermodynamic or information entropy. It is measuring probability info of an event to happen in the near future.

Some time ago I made evaluation of entropy and fractal indicators for trading simple setting them as an inputs together with other inputs for training NN in Neuroshell. Than during training GO applies to chosen inputs proper importance weight. This procedure is also called attribute selection in Machine Learning world.

The results was that entropy and fractal indicators were not chosen at all as a valuable inputs, perhaps this test can be repeated now by NS users.

So do you know any method which will prove beyond reasonable doubt that market entropy is useful for trading ??

Krzysztof
 
The idea of the EUR/CHF is to mix fundamental analysis with Algorithmic use of the current anti-persistence in that pair. This is classic: low take profits (as the price movement is anti - persistent (going up and down all the time) they are often hit). Big stop loss : however the stop loss was fundamentally driven by a Central bank statement and we trade only in that direction.

The fundamental thing comes from a statement from the Swiss National bank.

As the Swiss bank would only buy at the level CHF 1.20 per Euro we do the same in that way the stop loss was dictated by a specific information.

That is why the expert was designed only to BUY. This was a completely opportunistic approach. vgc has released the expert in public on the 17.09. The time we figure out what is it, the time we back and forward test. And the opportunity is maybe gone.

What remains is how the combination between fundamental information and quantitative approach can create temporally holy grails.
 
...The results was that entropy and fractal indicators were not chosen at all as a valuable inputs, perhaps this test can be repeated now by NS users.

So do you know any method which will prove beyond reasonable doubt that market entropy is useful for trading ??
When people mention the word entropy, I think there's a critical misunderstanding/misuse of the word. Entropy (imo) is a probabilistic info measure of a particular event. This will result in an indicator where if the value is relatively low, the anticipated event will soon likely to happen and vice versa when it is high. So instead of throwing any indicator called 'entropy' and check if it has correlation with certain description of movement like what is being done here, it should be constructed the other way around. What is it that we are trying to predict, how can we measure the information leading up to that event, what is the procedure needed to do so?

As for NN feature extraction / data selection, you cannot just throw any time series data and expect the NN to filter through it without some sort of mechanical relationship preprocessing. Yes, this applies even in feature extraction phase. This is a classic and fundamental problem in mechanical learning. The statistical engine learns by picking up correlations of shrinking and expanding values between inputs compared to outputs within maximum/minimum data bounds. How does a fractal information (which is a location value, just like OHLC) contributes to movement/vector event mechanics? How does your 'market entropy' or any other data support/counter the desired output? Also important, what does the NN output describes and how will it be used? Present all data properly, and only then it may be recognized as useful or not to the NN engine. Always keep in mind that NN is just a dumb calculator.

From my experience so far with mechanical learning, the biggest and most critical cuplrits are usually in questions being asked to the NN engine. By having the proper questions, I learned to select, process, and present my data so that it has mechanical construct to the question/output. The more direct, the better.

So instead of answering your question, allow me to propose a proper and thorough philosophical and mathematical inquiry into the 'market entropy' term used here. First question would be: market entropy of what event? Know what we're asking for. Know the presented data. From there, construct all necessary calculation accordingly and proceed with statistical interrogation of the data.
 
Top