Hi Clarod,
Yes you can send it to me, preferred if you can send the c code, I would compare it the formula given by Ehler. I found inside mq4 code:
if (NumOfBars < 7)
{
Smooth= (iMA(NULL,0,1,0,0,Price,i) + (2*iMA(NULL,0,1,0,0,Price,i+1)) + (2*iMA(NULL,0,1,0,0,Price,i+2)))/4;
}
Smooth= (iMA(NULL,0,1,0,0,Price,i) + (2*iMA(NULL,0,1,0,0,Price,i+1)) + (2*iMA(NULL,0,1,0,0,Price,i+2)) + iMA(NULL,0,1,0,0,Price,i+3))/6;
Itrend= (alpha - alpha*alpha/4) * Smooth+ 0.5*alpha*alpha*Smooth[i+1] - (alpha-0.75*alpha*alpha)*Smooth[i+2] + 2*(1 - alpha)*Itrend[i+1] - (1 - alpha)*(1 - alpha)*Itrend[i+2];
Trigger= Itrend[i+1];
}
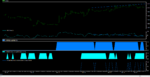
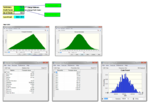
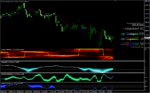
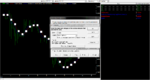
About corona, I am not sure if we can show the corona in NST. I have sample in MT4, if you have the formula and implement it on C then you can create dll file.
Here I shown Itrend and corona in MT4