Technical Analysis Bollinger Bands – The Basic Rules

One of the great joys of having invented an analytical technique such as Bollinger Bands (see desc. below) is seeing what other people do with it. While there are many ways to use Bollinger Bands, following are a few rules that serve as a good beginning point.
  1. Bollinger Bands provide a relative definition of high and low.
  2. </span />That relative definition can be used to compare price action and indicator action to arrive at rigorous buy and sell decisions.
  3. Appropriate indicators can be derived from momentum, volume, sentiment, open interest, inter-market data, etc.
  4. Volatility and trend have already been deployed in the construction of Bollinger Bands, so their use for confirmation of price action is not recommended.
  5. The indicators used should not be directly related to one another. For example, you might use one momentum indicator and one volume indicator successfully, but two momentum indicators aren't better than one.
  6. Bollinger Bands can also be used to clarify pure price patterns such as "M" tops and "W" bottoms, momentum shifts, etc.
  7. Price can, and does, walk up the upper Bollinger Band and down the lower Bollinger Band.
  8. Closes outside the Bollinger Bands are continuation signals, not reversal signals. (This has been the basis for many successful volatility breakout systems.)
  9. The default parameters of 20 periods for the moving average and standard deviation calculations, and two standard deviations for the bandwidth are just that, defaults. The actual parameters needed for any given market/task may be different.
  10. The average deployed should not be the best one for crossovers. Rather, it should be descriptive of the intermediate-term trend.
  11. If the average is lengthened the number of standard deviations needs to be increased simultaneously; from 2 at 20 periods, to 2.5 at 50 periods. Likewise, if the average is shortened the number of standard deviations should be reduced; from 2 at 20 periods, to 1.5 at 10 periods.
  12. Bollinger Bands are based upon a simple moving average. This is because a simple moving average is used in the standard deviation calculation and we wish to be logically consistent.
  13. Make no statistical assumptions based on the use of the standard deviation calculation in the construction of the bands. The sample size in most deployments of Bollinger Bands is simply too small for statistical significance.
  14. Indicators can be normalized with %b, eliminating fixed thresholds in the process.
  15. Finally, tags of the bands are just that, tags not signals. A tag of the upper Bollinger Band is NOT in-and-of-itself a sell signal. A tag of the lower Bollinger Band is NOT in-and-of-itself a buy signal.


Editor's Note: Bollinger Bands are a fairly ubiquitous study in modern technical analysis. Their creator, John Bollinger, offers his advice for their application above. For those new to the Bands, they can be thought of as a volatility adaptive moving average envelope or channel. Notice in the chart below how the Bands widen or narrow based on the market's volatility (in this case monthly S&P e-mini prices).

image1-58.jpg


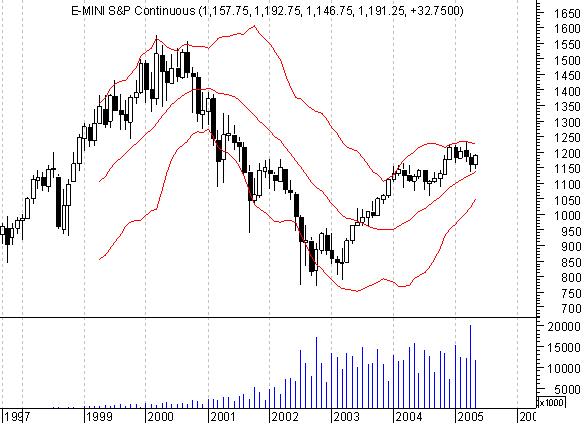
The central line of the Bollinger Band plot is a simple moving average. The upper Band is plotted a number of standard deviations above the average, and the lower Band is drawn the same distance below. The standard deviation is calculated on the same data as the moving average. The default setting of many charting systems is 20 periods for the average and 2 standard deviations for the Band plot.
 
Last edited by a moderator:
In this article, the creator of Bollinger Bands offers up some advice on how best to put them to use.
 
Bollinger band assumes financial time series are of STATIONARY type.. This is an un acceptable assumption and I strongly advise traders to igone any entry signals given by these two bands.

( STATIONARY DATA DONOT CARRY INFORMATION WITH THEM SUCH AS RANDOM MOVEMENT OF BALLS IN THE NATIONAL LOTTERY DRAW .. NON STATIONARY DATA CARRY INFORMATION SUCH AS VOICE , STOCK PRICE FLUCTUATION, AND SO ON ,,, )

iraj
 
Classic..............

Closes outside the Bollinger Bands are continuation signals, not reversal signals. (This has been the basis for many successful volatility breakout systems.)

And on the included chart, every close OUTSIDE the Bollinger Bands resulted in a REVERSAL, not a CONTINUATION.

Of course you may argue that it was a reversal, followed by a continuation, until it wasn't.
But, as always, there's wide scope for interpretation.

cheers d998
 
Agreed. Bollingers Bands are like most indicators in that manner. In the article, Bollinger actually advises against using them for entry signals. Doesn't mean they can't be handy, though.

By the way, I'm not a math genius or physicist, but it strikes me that the movement of balls in the lottery draw is not actually random - no more so than the movement of financial markets. :)
 
Rhody Trader said:
Agreed. Bollingers Bands are like most indicators in that manner. In the article, Bollinger actually advises against using them for entry signals. Doesn't mean they can't be handy, though.

Coin can be handy too

By the way, I'm not a math genius or physicist, but it strikes me that the movement of balls in the lottery draw is not actually random - no more so than the movement of financial markets. :)


if the market was totally effcient ( LOTTERY DRAW ,, PURE LUCK ) then no amount of analysis would be of any use .. We as traders by defintion agree financial time series have a degree of predictibility in them HENCE OUR ANALYSIS HENCE OUR JOB HENCE THIS BB
 
"A picture tells a story of a thousand words!" so they say.

Yep!.. :)
 

Attachments

  • cable weekly bolly.JPG
    cable weekly bolly.JPG
    127.6 KB · Views: 1,445
re

Bollinger bands and price action are the bees knees,need note say anymore.
 
darktone said:
"A picture tells a story of a thousand words!" so they say.

Yep!.. :)
Like all these 'obvious' aids to trading :LOL: it's only when you come to actively trade them live you realise what it is they aren't telling you.

I really thought Bollies alone would do the job when I started out. Sell on close above upper band - buy on close below lower band. Easy Peasy!!!

JHC!!!
 
TheBramble said:
Like all these 'obvious' aids to trading :LOL: it's only when you come to actively trade them live you realise what it is they aren't telling you.

I really thought Bollies alone would do the job when I started out. Sell on close above upper band - buy on close below lower band. Easy Peasy!!!

JHC!!!

;)
I see the bollies as overbought and oversold areas. I only keep a watch on the weekly (i actually put them on a daily chart but extend the average so it plots a weekly bolly on a daily chart) then use 4 and 1 hour price action for reversal signs and a 10 min for entry. :).

To put it into perspective looking at a bolly chart takes around 10 mins per week of my time :LOL:

Easy Peasy!!!
i been there 2 mate with super doooper bolly break plays using big averages on 4hour TFs :cool: ...........needless to say they didnt work!!!!!!! ROFLMAO :LOL:
 
Seriously though, what is it that convinces newbie traders, who, I assume are at the very least a lot more intelligent than I thought I was when I started, that they've spotted the bleedin' obvious whereas the assembled masses of clued-up, battle-hardened and experienced professionals with a couple of acres of super-fast hardware and state-of-the-art-plus software against whom they think they are trading, have simply not been able to find it - try as they might?

I wouldn't want to dampen this enthusiasm or indeed the much needed inflows of stupid money into the 'pot'.

It is also, I believe, a tribute to the aspirations of mankind that many still feel they and they alone have been blessed by the Universe to be able to find their edge so quickly and so easily.
 
TheBramble said:
Seriously though, what is it that convinces newbie traders, who, I assume are at the very least a lot more intelligent than I thought I was when I started, that they've spotted the bleedin' obvious whereas the assembled masses of clued-up, battle-hardened and experienced professionals with a couple of acres of super-fast hardware and state-of-the-art-plus software against whom they think they are trading, have simply not been able to find it - try as they might?

I wouldn't want to dampen this enthusiasm or indeed the much needed inflows of stupid money into the 'pot'.

It is also, I believe, a tribute to the aspirations of mankind that many still feel they and they alone have been blessed by the Universe to be able to find their edge so quickly and so easily.


Grey1 been practising , teaching, and full time trading the market for over 7.5 years.. Grey 1 has lost enought $$$ on Bollinger bands as well its recommended sister RSI in his early days of trading ..

Grey 1 is currently trading for a US bank UK division using various market neutral strategies and currently has met his 3% weekly target in da bank over the last 12 month .. Grey 1 recommends not to ignore his comments on da bollinger bands cos other wise ya be losing ur cash to ourselves..


it is ur $$$ it is ur choice

PS:-- bramble is talking sence you better listen to him if you are new to this game
 
Grey1 said:
Grey1 been practising , teaching, and full time trading the market for over 7.5 years.. Grey 1 has lost enought $$$ on Bollinger bands as well its recommended sister RSI in his early days of trading ..

Grey 1 is currently trading for a US bank UK division using various market neutral strategies and currently has met his 3% weekly target in da bank over the last 12 month .. Grey 1 recommends not to ignore his comments on da bollinger bands cos other wise ya be losing ur cash to ourselves..


it is ur $$$ it is ur choice

PS:-- bramble is talking sence you better listen to him if you are new to this game
But you must admit that the appeal of the decorative value of these expanding and contracting lines is very hard for shortcutters to resist.
 
Bollinger Bands used together with candlesticks and support and resistance areas make a tremenduous combination for trading stocks. Many of the conventional uses for BB's were tested on and therefore apply to commodities and futures. Stocks work somewhat differently in my opinion.
 
just out of interest, over on StrategyBuilder (sp) website, Bunnygirl has a Bollinger Band strategy.

there is a pdf called "gimmeebars" or something.

general overview:
it uses a breach of the Bollinger Band, ( ie; a price that spikes through the band, and closes below, and closes below the open-price of the same bar ) as a trigger.
You place a sell order below the extreme of the bar.( when the price has jumped up to the band )
Or a buy order if the range has dipped to the band.

seems interesting. it acknowledges that you done just sell/buy on the hit of the band, in case it runs away from you.

Also, it is from Bunnygirl, who came up with the 20WMA/5WMA strat.
 
Bollinger Bands need confirmation

I back tested Bollinger Bands twenty years ago specifically on stocks. The most profitable technique was to wait until the price closed back inside the top or bottom band and then entering a position with the intent of the price going to the opposite band. I compared this to the pendulum having swung too far in one direction, and it was now time for a compensating swing in the opposite direction. It appeared to me that this worked over half the time. However, the time frame was unknown.
Another technique of entering a stock position whenever a stock's price closed outside the bands, called a continuation move, was just was not profitable for stocks. The price did not stay outside the bands long enough to be consistently profitable in the aggregate.
I still use Bollinger Bands for trading stocks today, but I use them with candlesticks and basic technical analysis for secondary and sometimes tertiary confirmations.
 
Top