Bodies or Wicks?

Profitsniper007

Active member
Messages
107
Likes
2
Is always interesting to see different perspectives and opinions on this one.

When you are drawing trend lines, S/R lines, fibs etc - do you use extreme high/lows (wicks) or the closes (bodies)?

I think bodies are best, I think they give a far better idea of true investor sentiment.

I think a lot of the time wicks the big wicks are formed from times of emotion (over greedy or over fearful) and are therefor less reliable.

What are your thoughts?
 
candlesticks for daily charts could be argued to have vailidity.

anything else is generally arbitrary.
2 candlesticks on one time-frame, one with a long body up, followed by the next candlestick with a long body down, can be seen concatenated as a single candlestick with a long wick.

Even when it comes to long wicks, such as in the infamous pin-bars, still have to be seen in context of the broader market for context.

hope that helps. :)

Thank you for your answer, was a good one.

Yes, I agree that candles need to be taken in the overall context of the market.
For example, a doji at the top of a up trend may be a good sell signal and a doji with bullish confirmation at the bottom of a down trend may be a good buy signal (the Japanize rice traders that developed the candle sticks said that a doji at the bottom needs confirmation since the weight of the market can still push it down) - but a doji in a side trend means nothing, it is just a sign of indecision and this is to be expected in a side trend.

Individually candles mean very little.

What I was asking though, is if/when you draw S/R lines, trend lines or fibs (which is using a bunch of candles) do you consider the high/low to be the wick of the body?

I think most traders agree that a new high/low (broken structure - or continued trend, on whatever time frame the analysis is being done) is defined by it closing above the previous high/low but I have found that there is often a variation of opinion on if this is the case on things such as fibs.
 
Is always interesting to see different perspectives and opinions on this one.

It is.

I'm completely used to finding myself entirely out of step with the prevailing consensus of "forum opinion" on this one.

It seems to me that the open and close are (for the most part) pretty arbitrary, whereas the high and the low actually tell you something significant, that can relate to support and resistance. If you take H1 candles, just as an example, and imagine that you measure them from 10-past the hour instead of the hour, and recorded them accordingly, the opens and closes would be significantly different, but the highs and lows reached by the market during the day wouldn't be any different.

OHLC-bar charts and candles give exactly the same information. They just present it with a different visual emphasis. The first emhpasises the highs and lows (from which I trade, myself). The second emphasises the opens and closes. I know few people agree with me, but I genuinely have some difficulty understanding why/how people can imagine that these are more significant. :eek:

I think bodies are best, I think they give a far better idea of true investor sentiment.

I promise I don't mean it even remotely impolitely, but I just don't understand this perspective at all. Talk to me - maybe you can enlighten me?! :confused:
 
It is.

I'm completely used to finding myself entirely out of step with the prevailing consensus of "forum opinion" on this one.

It seems to me that the open and close are (for the most part) pretty arbitrary, whereas the high and the low actually tell you something significant, that can relate to support and resistance. If you take H1 candles, just as an example, and imagine that you measure them from 10-past the hour instead of the hour, and recorded them accordingly, the opens and closes would be significantly different, but the highs and lows reached by the market during the day wouldn't be any different.

OHLC-bar charts and candles give exactly the same information. They just present it with a different visual emphasis. The first emhpasises the highs and lows (from which I trade, myself). The second emphasises the opens and closes. I know few people agree with me, but I genuinely have some difficulty understanding why/how people can imagine that these are more significant. :eek:


I promise I don't mean it even remotely impolitely, but I just don't understand this perspective at all. Talk to me - maybe you can enlighten me?! :confused:

Thank you for your reply and you make your point very elegantly when you say;

"just as an example, and imagine that you measure them from 10-past the hour instead of the hour, and recorded them accordingly, the opens and closes would be significantly different, but the highs and lows reached by the market during the day wouldn't be any different."

One reason, is I think a lot of the time wicks the big wicks are formed from times of emotion (over greedy or over fearful) and are therefor less reliable.

Let's say there is a news flash and price falls dramatically but then it's snapped up and recovers, to me, this suggests price was not really meant to be down there, was just a flash.

My opinion comes a lot more from what I have observed rather than my theorising what is behind it.

I trade a lot with fibs and harmonic patterns (usually backed with fibs) and I have found when I go though testing that the closes match with my patterns in hindsight better than the high/lows do (this may be because the people trading these patterns use the same methods, I don't know, I do tend to go for a "who cares" approach as to why things work, as long as they work - if they don't work, that is when I start to care why not lol)

So, with my strategies and my personal experience I have found that the closes better indicate what may happen (maybe investor sentiment was the wrong term here)

The only time I use the wicks is if I was going to trade a pin bar style candle as a reversal, I would take the whole candle and you to get in on a 61% retrace of that, with stop under the low

(I find this gives a good enough R/R ratio to make it a profitable thing to trade since you have around 1:1 just to the top of the candle, and overall you can have 3:1 or better, I would usually take 38% fib as target one here if counter trend trading, and a 127% -or more depending on a few factors- extension of the retrace if I was looking to enter on the -what I believe to be- end of a trend correction.)
 
candlesticks for daily charts could be argued to have vailidity.

anything else is generally arbitrary.
2 candlesticks on one time-frame, one with a long body up, followed by the next candlestick with a long body down, can be seen concatenated as a single candlestick with a long wick.

Even when it comes to long wicks, such as in the infamous pin-bars, still have to be seen in context of the broader market for context.

hope that helps. :)

I dont agree. Candlesticks are not arbitrary. They are what they are. They are useful for marking highs and lows for a given period. They also can show levels that price could not close above/below. As trading is a competition between humans we also need to understand how different participants will use candlesticks.
 
Thanks for your reply.

One reason, is I think a lot of the time wicks the big wicks are formed from times of emotion (over greedy or over fearful) and are therefor less reliable.

I don't quite see the "therefore", myself. Greed and fear are everyday market drivers, I think.

It seems to me that the tips of the wicks (the high and low) are objective and simply "where the market reached before reversing", i.e. they indicate support and/or resistance, which means something.

The length of the wicks depends, clearly, on their distance from the open and close, which seem to me, for the reasons explained in my post above, to be more or less arbitrary by comparison.

Let's say there is a news flash and price falls dramatically but then it's snapped up and recovers, to me, this suggests price was not really meant to be down there, was just a flash.

Granted, things like this can happen, but these are occasional exceptions you're talking about here, surely? :|

My opinion comes a lot more from what I have observed rather than my theorising what is behind it.

Well, if it does, it does; but this, of course, makes it very much more difficult for people to discuss it with you. :eek:

I trade a lot with fibs and harmonic patterns (usually backed with fibs)

I don't believe in any of those.

I do tend to go for a "who cares" approach as to why things work

Fair enough. I'm rather more interested in the underlying theory and the ways in which market sentiment and human behaviour are translated into significantly repeating price action patterns. (I thought - evidently wrongly - that this was the kind of discussion your thread invited.) Which, again, makes it difficult to discuss, perhaps, from our very different perspectives.

Candlesticks are not arbitrary. They are what they are. They are useful for marking highs and lows for a given period.

But no more so than OHLC-bar charts, surely? Bar charts give exactly the same information, after all, but with more visual emphasis on the highs and lows?
 
But no more so than OHLC-bar charts, surely? Bar charts give exactly the same information, after all, but with more visual emphasis on the highs and lows?

Not sure what you are getting at. A candlestick contains 4 pieces of info open high low close, end of. No need to overcomplicate. Give a human a charting package with 10 different ways to plot price and it confuses the hell out of most people. I would focus on understanding why price moves and how to not lose.
 
Not sure what you are getting at. A candlestick contains 4 pieces of info open high low close

So does an OHLC-bar chart.

Not sure what you are getting at.

Sorry - I was simply responding to your comment that candles are "useful for marking highs and lows for a given period".

It seems to me that candles, visually emphasising as they do the open and close rather than the high and the low, are actually rather less "useful for marking highs and lows for a given period" than bars are. :)

No need to overcomplicate.

No, indeed. But in a thread entitled "Bodies or Wicks", one's bound to be talking about whether highs/low signify more than opens/closes, I think? That's just a paraphrasal of the title, surely? :|
 
Thanks for your reply.


I don't quite see the "therefore", myself. Greed and fear are everyday market drivers, I think.

It seems to me that the tips of the wicks (the high and low) are objective and simply "where the market reached before reversing", i.e. they indicate support and/or resistance, which means something.

The length of the wicks depends, clearly, on their distance from the open and close, which seem to me, for the reasons explained in my post above, to be more or less arbitrary by comparison.


Granted, things like this can happen, but these are occasional exceptions you're talking about here, surely? :|


Well, if it does, it does; but this, of course, makes it very much more difficult for people to discuss it with you. :eek:


I don't believe in any of those.


Fair enough. I'm rather more interested in the underlying theory and the ways in which market sentiment and human behaviour are translated into significantly repeating price action patterns. (I thought - evidently wrongly - that this was the kind of discussion your thread invited.) Which, again, makes it difficult to discuss, perhaps, from our very different perspectives.


But no more so than OHLC-bar charts, surely? Bar charts give exactly the same information, after all, but with more visual emphasis on the highs and lows?

I am going to try and answer using the quotes like you done, it looks far better, but I messed it up last time I tried it so apologies in advance if I do that again :)

Firstly let me say, I do not disagree with most of what you have said, I do not profess to be right, I just offered my opinion to get the ball rolling.

It seems to me that the tips of the wicks (the high and low) are objective and simply "where the market reached before reversing", i.e. they indicate support and/or resistance, which means something.

I agree, I would generally use the wicks as my stops actually, but not base my analysis around them. I base that on the closes.

Granted, things like this can happen, but these are occasional exceptions you're talking about here, surely? :|

News event, yes. However there are other times such as (I believe) when banks need liquidity, they will spike the price to hit stops to get the buyers they need to sell (and vice v) which I believe happens pretty often, so the wick in this case is manufactured to meet a ends.

Well, if it does, it does; but this, of course, makes it very much more difficult for people to discuss it with you. :eek:

Again, I do not profess to be right :) My thoughts are just matched with my experiences.

I don't believe in any of those.

Many don't. I know a lot of people say they work well only in hindsight, but I have found them to be very useful.
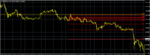
I have attached a picture (well I have not actually done it yet, but by the time you read this, I have :D ) which shows if you shorted UJ on the bearish engulfing candle on Thursday and used the extensions as targets, price respected them well - I know this may look like a perfect example, but I never poured over tons of charts and time frames to find this, was just what my MT4 was open on - this happens very often. Zoomed in you see while the wicks violate these levels, the closes usually respect them.

The sell signal seems to come right off the 61% retrace as well (just from looking, never drew a fib, so may be wrong)

Fair enough. I'm rather more interested in the underlying theory and the ways in which market sentiment and human behaviour are translated into significantly repeating price action patterns. (I thought - evidently wrongly - that this was the kind of discussion your thread invited.) Which, again, makes it difficult to discuss, perhaps, from our very different perspectives.

Theory interests me greatly, just not when I am actually trading.
Another example would be, I love economics but I do not use them when making trades, I trade techs.

The intention of this thread was for people to discuss (hopefully pleasantly - I have noticed a lot of people tend to be rude about here, not referring to you Alexa, you seem very pleasant) their different opinions.

While it will be unlikely to change my trading style, objectivity is always educational and thought provoking.
 
Last edited:
But the attachment never worked I think lol.

....Always something.
 

Attachments

  • uj.PNG
    uj.PNG
    28.5 KB · Views: 520
Zoomed in you see while the wicks violate these levels, the closes usually respect them.

I should add, that once there is a close violating these levels, this is where I consider making a trading decision.

So hopefully you can see in this strategy, if I entered on a pending once a wick violated it, I would be faked out a lot. If I use a closed candle (there are other rules as well) it is far more reliable for my strategy.

I agree completely this time with you sniper. I'm happy just by looking at a line on close chart, anything else for me is just noise.
 
I expect a programmer could amalgamate the two methods by drawing a ma on half the wicks ?
 
Top