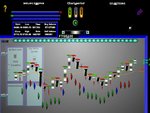
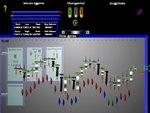
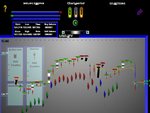
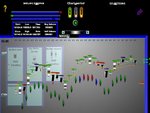
Beartops Currency/Indices Journal

Bad Trade

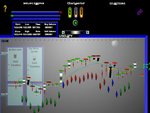
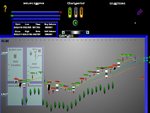
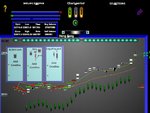
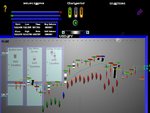
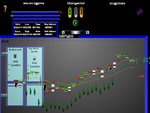
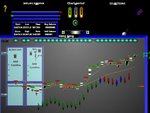
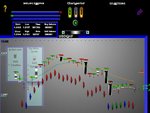
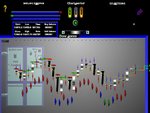
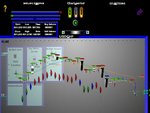
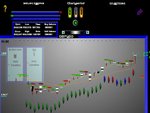
The 050707 was a disappointment , luckily I didn't put anything on it.
Bullish Harami's have appeared before in the Nikkei with good results.
If I trade to the Rules I have posted before , I ideally should have gone for a Spring with a Momentum switch
 

Attachments

  • NIKKEI050707Spring.JPG
    NIKKEI050707Spring.JPG
    65 KB · Views: 184
  • NIKKEI060707.JPG
    NIKKEI060707.JPG
    85.7 KB · Views: 175
Last edited by a moderator:
More on R&D of Non Incident Angled Light

Some Nano Structures
 

Attachments

  • 004.JPG
    004.JPG
    42.3 KB · Views: 164
  • 005.JPG
    005.JPG
    72.7 KB · Views: 194
  • 006.JPG
    006.JPG
    53.6 KB · Views: 159
  • Manufact2.JPG
    Manufact2.JPG
    51.5 KB · Views: 156
Last edited by a moderator:
Jpy 050707 -> 060707

I like the look of the yen Long with a stop loss at half the previous candles rise
 

Attachments

  • JPY060707.JPG
    JPY060707.JPG
    82.4 KB · Views: 159
  • JPY050707.JPG
    JPY050707.JPG
    83.6 KB · Views: 165
Gbpusd Ftse 050707 -> 060707

Advancing wave on the FTSE with a Fib down . looking for something stronger.
 

Attachments

  • FTSE050707.JPG
    FTSE050707.JPG
    84.3 KB · Views: 153
  • FTSE060707.JPG
    FTSE060707.JPG
    88.2 KB · Views: 160
  • GBP050707.JPG
    GBP050707.JPG
    81 KB · Views: 157
  • GBP060707.JPG
    GBP060707.JPG
    82.1 KB · Views: 176
Jpy,gbp,nikkei,ftse 090707

I've omitted sunday on currency so it will be interesting if the Fib is as accurate.
The FTSE Fibonnaci is up , however could be in a wave cycle , prefer to watch for further indicator.

After putting in sunday data 80707 for GBP there seems to be a switch with a Fibonnaci down.(There wasn't any difference without the 080707 , see below PIC) This has occured before 220607 with good predictive results.
Closely looking at a trade next trading session
 

Attachments

  • GBP090707.JPG
    GBP090707.JPG
    80.6 KB · Views: 184
  • JPY090707.JPG
    JPY090707.JPG
    81.4 KB · Views: 192
  • NIKKEI090707.JPG
    NIKKEI090707.JPG
    83.6 KB · Views: 183
  • FTSE090707.JPG
    FTSE090707.JPG
    88.4 KB · Views: 200
Last edited by a moderator:
Heng-Seng 04 -> 090707

I like the look of this market , trending nicely
 

Attachments

  • HengSeng040707.JPG
    HengSeng040707.JPG
    83.4 KB · Views: 166
  • HengSeng050707.JPG
    HengSeng050707.JPG
    81 KB · Views: 170
  • HengSeng060707.JPG
    HengSeng060707.JPG
    87.7 KB · Views: 181
  • HengSeng090707.JPG
    HengSeng090707.JPG
    82.4 KB · Views: 173
Usdchf 05 -> 090707

Very interesting Fib , First time I've had >3 consecutive trading sessions above session high. Also with a switch I haven't seen.
 

Attachments

  • CHF090707.JPG
    CHF090707.JPG
    82.2 KB · Views: 198
  • CHF080707.JPG
    CHF080707.JPG
    81.8 KB · Views: 183
  • CHF060707.JPG
    CHF060707.JPG
    79.7 KB · Views: 184
  • CHF050707.JPG
    CHF050707.JPG
    81.8 KB · Views: 178
030707 -> 090707 Engulfing Bull

I've been following the Dow Jones waiting for it to stabilise from Ruperts share grab.
I particularly find the Engulfing Bull interesting(prehaps Counter Posed Fibonnaci). There may well be a future stratergy well
worth pursuing.
 

Attachments

  • DowJones030707.JPG
    DowJones030707.JPG
    87.2 KB · Views: 192
  • DowJones050707.JPG
    DowJones050707.JPG
    84.9 KB · Views: 169
  • DowJones060707.JPG
    DowJones060707.JPG
    82.5 KB · Views: 205
  • DowJones090707.JPG
    DowJones090707.JPG
    85 KB · Views: 166
Last edited by a moderator:
Gbpusd

Following from 100707 , a short with a tight stop taking half the adjusted fib closing out once reached.
 
Mate,

Maybe I'm missing something - but I really do not understand what your proprietary charting system is showing and furthermore, what you are trying to achieve with your posts. As far as I can tell:

1. You have not posted any trades, and,
2. Even if you did, the pictures you post (to me anyway) seem meaningless, and,
3. What is the purpose of the angle of inflection of light type pictures you post ?

I'm sure I'm not the only one to be thinking this, but realistically, without any form of explanation, discussion, please stop posting your charts as they seem to mean nothing. If I'm wrong, then please provide responses to my questions above.

I'm reluctant to classify your posts as drivel, but in the absence of any explanation/clarity of purpose, I feel that is what's necessary...
 
Reply to General

As I have stated previously , I am Testing out my model whose purpose is R&D.
To present in this way has forced me to acknowledge short comings in my trading stratergy. Hopefully with the knowledge I have gained I can apply it to the formulation of a means to a tangible end.
I take it as a complement that you youself cannot assimulate the purpose of the underlying.
I myself have never been in the Pit and am too old to ever be.
Therefor , If you are to be the one to accept the trade I will endevour to be more precise in the factual detail in which I will present.
Please accept I shall be ready in presentation by Nov
 

Attachments

  • JPY100707.JPG
    JPY100707.JPG
    82.1 KB · Views: 201
  • CHF100707.JPG
    CHF100707.JPG
    83.1 KB · Views: 196
  • GBP100707.JPG
    GBP100707.JPG
    77.6 KB · Views: 206
Last edited by a moderator:
Top