hello fellow traders
Time tested but used by so few, the andrews pitchfork is a tool very often over looked by traders. things i love about this tool are the following:
1) they have worked since early 19th century and remain so to date.
2) solid trading plans can be put to use
3) leading indicator of market direction
4) you have an 80% probability that price will return to the median
even with all this i have come accross many traders that have struggled to use it but like any profession you need to master your tools to master yout work.
here are some rules to follow when using this tool.
1) always trade in the direction of the curent pitchfork describing price
2) make sure your fork is tested to ensure price is being described by the fork
3) patience while price makes its way to those sweet spots . anything else is just not a setup to be risking.
4) let price show you the market sentiment when price comes to your sweet spot zones.
i will start postig some charts and setups with this tool on this thread starting with eurusd going forward this week.
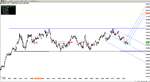
look at the 4 hour chart. we are clearly stuck in a big range but direct your attention to the red circles on the chart, historically this is a level where price has either bounced or consolidated before it broke. currently (green circle) we have made a double bottom. although the major fork is describing price we seem to have hit a level where we could see a nice bounce. lets take a closer look..
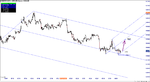
open the 60 minute chart
we know we have a double bottom, we also have a new set of pivots to use for a new bullish fork which should project prices path out of this zone, as you can see we already had 1 good test where price has begun its journey out of this area. right now we dont have enough evidence to go long just yet. what we need is another test of the lower median parallel and price needs to test and hold with a close, the kind of bar we are looking for is a what some call a pin bar, i really dont have a name for it only i can say is that sellers have all the chance in the world to break that tested line and dont and then buyers come in creating this candle. this is the evidence we need and if price is holding this frequency once we get it we can look to take a low risk long trade with a target being the median line..
lets see what this week will bring
Time tested but used by so few, the andrews pitchfork is a tool very often over looked by traders. things i love about this tool are the following:
1) they have worked since early 19th century and remain so to date.
2) solid trading plans can be put to use
3) leading indicator of market direction
4) you have an 80% probability that price will return to the median
even with all this i have come accross many traders that have struggled to use it but like any profession you need to master your tools to master yout work.
here are some rules to follow when using this tool.
1) always trade in the direction of the curent pitchfork describing price
2) make sure your fork is tested to ensure price is being described by the fork
3) patience while price makes its way to those sweet spots . anything else is just not a setup to be risking.
4) let price show you the market sentiment when price comes to your sweet spot zones.
i will start postig some charts and setups with this tool on this thread starting with eurusd going forward this week.
look at the 4 hour chart. we are clearly stuck in a big range but direct your attention to the red circles on the chart, historically this is a level where price has either bounced or consolidated before it broke. currently (green circle) we have made a double bottom. although the major fork is describing price we seem to have hit a level where we could see a nice bounce. lets take a closer look..
open the 60 minute chart
we know we have a double bottom, we also have a new set of pivots to use for a new bullish fork which should project prices path out of this zone, as you can see we already had 1 good test where price has begun its journey out of this area. right now we dont have enough evidence to go long just yet. what we need is another test of the lower median parallel and price needs to test and hold with a close, the kind of bar we are looking for is a what some call a pin bar, i really dont have a name for it only i can say is that sellers have all the chance in the world to break that tested line and dont and then buyers come in creating this candle. this is the evidence we need and if price is holding this frequency once we get it we can look to take a low risk long trade with a target being the median line..
lets see what this week will bring