kimo'sabby
Experienced member
- Messages
- 1,622
- Likes
- 287
i believe there's a firebird ea that works off ha candles.. check out ff, i can't get ff at mo, anyone else?
FF is being maintained at the mo. Thanks for the heads up.
i believe there's a firebird ea that works off ha candles.. check out ff, i can't get ff at mo, anyone else?
I''ll pop the test of HA up after 🙂Cheers LM. I notice quite a few people add more indicators, especially macd and mas. I won't be doing this, i don't think there's any point, either the HA alone has something or it doesn't.
As LV has already stated, more discretion may be needed.
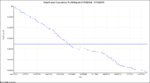
I''ll pop the test of HA up after 🙂
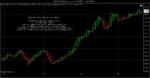
I'll include a chart plot of 2 X ema1 (essentially zero lag ema) each with input of HAopen and HAclose.
That will graphically illustrate that HA is little better than a moving average cross
with each ma having same value but one offset by 1-3 bars.
HA works great when markets trend, but there is nothing built in
to differentiate between trending and ranging markets.
Dinos uses HA, but I personally think he is using greater timing finesse based
on m1 with a keen eye on general news, sentiment and market conditions for that session.
That will always be the bugbear of automation if you go down the indicator route.
Pure automation is binary logic - either the rule is satisfied or not, there
are no shades of grey.
Thats why the vast majority of indicators are quite often worse than random
in this environment, they are already little better than 50-50, throw in the lag
and you're screwed.
Mmmm. Would we be better off just putting in trades/orders at regular time intervals (or non-regular)?
If the statement, "a trend is more likely to continue", is true. This must surely be the base logic?
Any coding would revolve around set prices, times and parameters.
I'm not going to elaborate too much on that, but yeah
you're on the right track.
Think of market constants - open, close, lunch, bond close,
typical fixed news release times, session times and so on.
They never change (within reason anyway).
I'm not saying trade AT those times, but there or there after, the liklihood
of something occurring is greatly increased.
I'm not going to detail exactly what I do, but that is much closer to the approach
I take than using indicators to pick entry.
Come on LV, elaborate a little😉

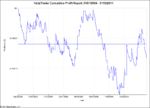
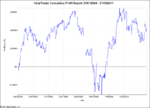
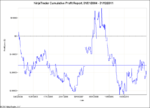
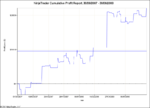
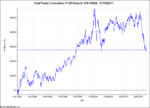
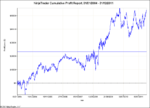
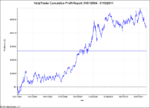
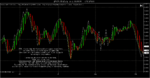
View attachment 149452
Have a butchers at this LV. Ordinary candles, between may 31 and aug 14, the trend didn't change until the daily % moves to the downside increased.
A simple rule could be implemented to avoid chop.
TBH you'd need to start adressing multi time frames, levels,
key action times, all sorts of stuff that add complexity and parameters.
Curve fitters paradise.
Seriously, you're better off looking at the stuff mentioned earlier.
its much more simple, and the bulk of the focus is on trade management and exits.
The reason that is simpler is because you have a hard metric to base
your code on - open PnL.
Anyway, I'm off soon, MOTO GP Valencia on TV 🙂
Cheers LM. I notice quite a few people add more indicators, especially macd and mas. I won't be doing this, i don't think there's any point, either the HA alone has something or it doesn't.