Depth Trade
Experienced member
- Messages
- 1,848
- Likes
- 99
When attempting to scalp the market on both sides, I've come accross a slight edge to be had using Sar with Macd.
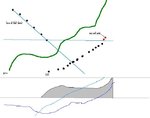
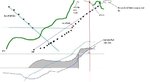
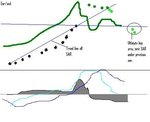
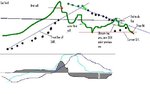
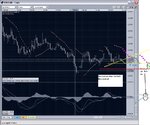
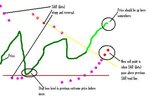
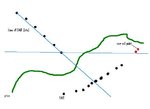
This strategy works best during the early morning after Indexes have opened for the day. Within about a half hour before or after the Indexes have opened, price will move and break through the Sar indicator. At this point you want to draw a trend line from start of broken Sar to the last Sar (dot). This new trend line off previous Sar (dots) becomes the signal that a new high has been reached, when new Sar (dots) break the trend line that was drawn off previous Sar (dots). Another clue for price maxing out is to draw a horizontal line off previous Sar broken, then when new Sar (dots) have broken this line, price will be even further out then on previously explained set-up.
Stop loss for these positions should be max price previously traded before break through Sar (dots).
Macd is for re-affirmation of price direction and over/under bias.
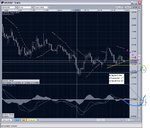
If some one could post a 5min with Sar and macd, that would be nice.
I did trade this strategy about 50 times for a profit, but found it took an immense amount of energy to 'stay on top of it' constantly.
😉
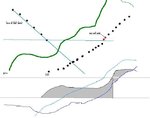
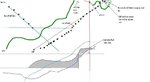
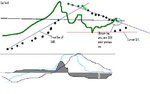
This strategy works best during the early morning after Indexes have opened for the day. Within about a half hour before or after the Indexes have opened, price will move and break through the Sar indicator. At this point you want to draw a trend line from start of broken Sar to the last Sar (dot). This new trend line off previous Sar (dots) becomes the signal that a new high has been reached, when new Sar (dots) break the trend line that was drawn off previous Sar (dots). Another clue for price maxing out is to draw a horizontal line off previous Sar broken, then when new Sar (dots) have broken this line, price will be even further out then on previously explained set-up.
Stop loss for these positions should be max price previously traded before break through Sar (dots).
Macd is for re-affirmation of price direction and over/under bias.
If some one could post a 5min with Sar and macd, that would be nice.
I did trade this strategy about 50 times for a profit, but found it took an immense amount of energy to 'stay on top of it' constantly.
😉
Attachments
Last edited: