4xpipcounter "nuggets"

Status
Not open for further replies.

4xpipcounter

Experienced member
Messages
1,557
Likes
29
Nugget 1--Understanding a trend.

It is important to understand the nature of a trend, and their personality. It is also important to know their interactions within the context of different timeframes. As I progress through this, I will give an even more visual concept other than what is accompanied in the attachments.

I feel like I am still in the introductions, but here goes. There will be no allusions from me towards worn out cliches like "The trend is your friend". Sounds good, but there is no soundness in that comment to trade by. As an example, what is a trend? Duh, but get my point. By the time you have looked on the chart and determined the trend (i.e--5 candles consecutively in one direction), that could be the point it is due to reverse. How many have bought into that saying, and then wondered why their trading account is on life support? This is partly due to why the markets are perceived with the arbitrariness in their movements onstead of the predictability, which really moves them.

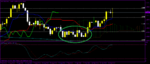
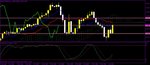
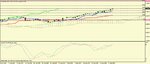
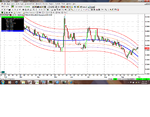
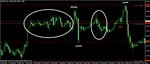
For now, I want to look in my rearview mirror and show a couple of trends to give a perspective. It's been asked several times what TF's do you use? Use all of them! Consider the encircled portion of the GBP/USD. It appears to have no trend. The hourly and 4-hour charts tell a complete different story. That bottoming out process was also predicted in my other thread. You might ask, "How did you know that?" My methodology is the answer. This why we need a method of knowing where and when a pair has been exhausted. During this time of sideways motion on the daily, bundles of pips were made on the intraday charts. The intraday charts were going way up, then way down, because the daily chart was at a point of indecision, but preparing for the move north that it made recently. Trend were going on all the time during that time, but the daily chart was sure not convinced.

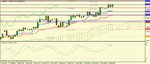
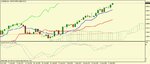
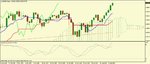
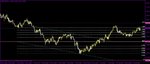
Look at the euro chart. That is a thing of beauty for the swing trade / LT trader. Predcitable? Read my other thread. The bottom of the cloud at 1.3838 was on the LT radar. Now, here is something that is good to know, and why traders not only need to have their set of indicators that represent their methodology, but they also need to understand how each one works, and how their chosen indicators interact with each other. If you sense there is homework to do on the way to 100% per...., then you are right.

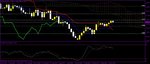
This interaction was conceived by the stochastics that I not only use as an OB /OS indicator, but also a momentum indicator. That works nice in conjunction with the ichimoku cloud. It tells my that type of crossover and the OS condition that it is headed to the kijun, which has now found its way under the cloud. Be perpared, though! Isn't it nice to know that when circa 1.3838 is hit that there will be a reversal?

The object is this. I am not saying like many fabricators would that have ulterior motives, that you could have gotten in at 1.1900 and got out at 1.3838 for a 1,938-pip gain. The main point here is when that DOWN (Referring to the monthly) was showing indication of coming to an end, be careful! If you want to be short on the hourly or 4-hour charts, that's okay, but be prepared to pull the plug on the trade, quickly. When the pair gets close to 1.3838, and there is a signal on the hourly to go long, go for it! But, make sure the finger is on the trigger.

Hang in there. I said the journey would be long. This is all leading to the end product.
 

Attachments

  • gbpusd d.png
    gbpusd d.png
    42.1 KB · Views: 249
  • eurusd m.jpg
    eurusd m.jpg
    74.8 KB · Views: 254
Nugget II--Marginging

Much clamor and concern for my margining habits and my risk appetite, so I will have to get back to the nugget I started on "Understanding a Trend". For now it's time to pull back the mystery on the concern of Tucker possibly being effected by Swan's meds.

This part of the picture would make a lot more sense after I finish the segment on the Trend. So, we'll jump in the middle of it. I'll discuss exactly how I can let trades go back on me 70% (The highest amount this year, btw.), not bad an eyelash, and come out 28% gain on the total equity. BTW, what I'm about ready to discuss in this part of the segment, I give strict adherance to 100% of the time.

The object in entering a trade is to find a place where either the ultimate pullback within a trend has happened, or find the ultimate peak or dip in a trend and find the reversal. It also helps in being aware of the TF the trader is considering, along with what is happened on higher TF's, and even some of the lower ones. In the first nugget I discussed how that cable had gone sideways on the daily, but was trending on the lower TF's. So, everytime I enter a trade, the timing is perfect, and the trade goes exactly as intended--NOT. It is those times that having a plan B in place has helped immensely.

My S&R's not only give excellent points for reversals or corrections, but they also measure a trend's decomposition, along with the length of the trend within that TF (Go to my other site for more info on my S&R's.) If I see where a possible reversal is at an S or R, I enter, but then if I get a continuation, then it will head to the next one. By now, I am down several pips. If I see the continuation is going to happen, I might wait for a pullabck to that particular reference point, and then exit, for the most part with a small loss. If in the event I am off by a whole leg, then I will wait for the next one to complete its run, add another position, and double my pleasure. Usually ,when I am off by one whole leg, the reversal happens with some explosiveness happiness that adds pips like crazy .(Did you see what happened to the GBP/CHF yesterday? That was my short. I was down by about 30 pips, and then Tucker and I go out for some chase-around-the-property fun. Then I had some friends over for some Hillbilly Golf, and then I came back in, which was 2 hours later, and the trade hit my TP for over 100 pips and over 10% gain on my account.)

Back to the scenario. Every once in awhile, I am off by 2 whole legs, which is the rarest of ordeals. That is when I add in a 3rd position. At that point, my wife gets jealous because I become married to the trade. By that point, it is a very extreme situation. This is where the backup plans comes to play.

Once the trade is buried by 2 legs, it almost has to move in my direction, because my methodology says so. The candles are flying too high above or sinking too far below the cloud. There's a mystic magnetism in the cloud that says, "You are returning to me." (I'll cover more of that later, too.) Still, there is no comfort zone until the Move happens. One of two things happens. I create a comfort zone, or I wait patiently.

You might say, "Create a comfort zone!? Are you stupit!?" And of course, Swan thinks me and Tucker are defintely on meds by now. Seriously, this is a business, and it has to be treated that way. (If you are struggling with your trading or are a newbie, paste and copy that last statement somewhere please.) How many times have we been told or read to never invest our last dime in the markets? I have self-proclaimed ice in my veins. If it wasn't for my backup plan, that ice would melt. In case of emergency, I always (Read and digest that last word please.), always (Repeating, just for good measure.) have an equi-amount of liquid assets as in my trading account. I can use it and in less than 5 minutes that recent deposit is reflected in my account. By putting equi-cash in my trading account, I have, in effect bought 1,000 pips. At that point I can sleep easy, knowing I have revived my comfort zone. Once the trade recovers. I take out the amount I paid for the "comfort zone", take my wife out to eat for doing such a splendid job, and life, once again is grand.

When was the last time I had to do that? Last year. There are also many ways to confidently measure when a pair has reached extremes. I will cover them in later nuggets.
 
Nugget III-- Margining II

Once again, finding a pair's extreme readings will take some time to develop, and so it is never advised to break all the stereotyped stop rules like I do. I have learned and take confidence in the fact my methodology allows me to find those extreme readings. Later, I will give live postings in this thread to better show what I am talking about. I will post charts with my methodology on it that will reveal those extreme readings, and I will post outside of my methodology.

The last paragraph had nothing to do with margining, and the title does say "Margining II", so I better get with it. Trading needs to be as less of a stress as possible. The mind needs to be clear in evaluating entries for trades (I'll cover more on that later.). The first thing to do is develop a methodology. That, a lot of times is the easy part. I made 50% on my demo account my 1st week. (Worse thing that ever happened to me. It's called a false confidence. It would have been better to bankrupt my account in the 1st week.) After the methodology has been established, then margin principles need to be established. IMO, the number one reason traders fail is the mental part. Too much stress, fear, doubt, greed, and whatever other mental obstacles work, and then the trading account reflects that. One of the things to prevent mental stress is to have a nest egg in the backgournd of your trading account. Vow to your self to never veer from that. If you adapt my strategy (read the previous nugget) of buying a comfort zone if you get in hot water, it is a big comfort in knowing it is there to back you up.

Someone told me, "But, Paul, I only got $1,000." I told him, "Fine. Play by the rules. Dump $500 in your savings account, and $500 in your trading account." It's that simple. If you come up with another $100 to invest, put $50 in the savings, and $50 in the trading. Your savings has to be a part of your total trading plan. Just be patient in the humble beginnings. Don't rush it. If you only have enough money to only play with the small fries, don't be ashamed of it. You will feel good after you doubled your account for the first time.

Another thing about margining is to make sure it fits your style of trading, and in lieu of your margining, make sure you are fully ensconced in your methodology. I can trade like a maniac, because my methodology has proven itself over and over again.

Here's another fact about my 10%. First, I already discussed the high-probablity my trades will yield. I could just ride one trade at a time. If I found the optimum entry, then odds are not too good the trade will back up on me 1,000 pips before it goes in my favor. This is one of my favorite lines I came up with, "It is not the journey that counts, but the final destiantion." I want to enter every trade and then take the jet to my final destination. But, odds are every trade will not turn out like my GBP/CHF did yesterday, so if it is the scenic route that must be taken, then so be it.

I hope that sheds some light on why I margin the way I do, and why my backup plan is part of the overall structure of my margining. It is the confidence in that, and why my account is up 162% this month, and 22% this week. This will probably be the last nugget devoted to margining, so jump in with questions, comments, and concerns. I'm planning the next nugget as we go back to "Trends".

This entire ordeal, BTW, is not designed to try and convince anyone to do as I do within the context of my methodology, or my margining, etc. It is designed to get traders to think, and to glean from these helpful nuggets. If you are not turning 100% over in predictable succession, then why not? Got to ask, you know. That is what this thread is all about. Much, much more to come. I only want "A" students in my class.
 
Nugget 4--Understanding a trend II

When the trend becomes stretched


In nugget 1, I alluded to an obvious strong R point for the EUR/USD. In that case, it does not mean the euro is going to reverse trends, nor does it mean the trend is overextended. All it means is that at that point it will make an excellent entry for short that should net no less than 200 pips.

The AUD/USD paints a bit of a different picture. This pair is about ready for a huge reversal. The whole idea is finding and discerning when it is going to happen. The daily chart is showing the aussie flying way to high above the cloud. View it as an airplane flying too far above a cloud. The altimeter shows that the plane needs to come down, because of the high altiude. The altimeter on this chart is also showing the same thing. There is always a gravitational pull towards the cloud.

The weekly chart looks even nicer. If you count the lines forweard when the cloud has sloped downward, you will count 6. The weekly chart will be flying 1,000 pips above the cloud in 6 weeks if we are at today's level. Even further into the future shows the cloud turning bearish as there is a crossover of both senkou spans.

Personally, I can only think short when I think of the aussie because of how imminently close we are to what promises to be a huge reversal. The pair has become what I would call overextended or stretched. It is all a matter of finding an entry and taking a long ride south. If all it does is hit the top of the weekly cloud, that's circa 1,000 pips. Based on 10% margining that is a 100% gain from current level. It means at 10%, and let's say there is 10K in the account, 1 lot would be put on that trade, and a gain of 10K. That would take weeks to evolve, but there has been much talk about 20% per year, 5 % per week. This is only one trade as we peer into the future.

Strong obviations on the higher TF's make for quicker and speedier gains. Some don't like to stay in a trade and hold it for weeks. Another way to do it is wait for the break on the TF in question, and then hold it into the next candle of the TF, and bail out for some very quick and tidy gains.

Just as an example of the above. I am curently long the GBP/USD. I got a strong signal on the 8-hour chart, along with a confluence of other events. I am just waiting for the first strong break and then getting out. WR1 is on the radar, which is 1.5918. This trade is on a much smaller scale than what we see happening with the AUD/USD. In orer to define an entry for the aussie, it could be helpful to scale down to a lower TF and finding an entry. Afterward watch for momentum. If there is none, get out, take the small gain, and wait for the next leg to finish. I don't mind taking the small 20 and 30-pip gains while waiting for the bigger picture to evolve. Even the smaller trades will be 2-3% while waiting for the Real Deal to happen.

In the very immediate future there is a strong confluence of events happening. I forgot to accompany my yearly S&R's on this chart, but I'll post the YP--YR1 zone on the next post. Notice the red line on the 4-hour chart. That is my WR2 at .9742. Another mark to look for is .9739, and that will be seen on the next chart.

My S&R's are not only helpful S&R indicators, but they have been formulized to find the period within a period that a trend has been stretched or to indicate where a bounce or reversal will happen. The yellow line at the bottom is the MR3 at .9382. When the 3's are broken, that is a strong implication heading into the next TF. This means the MR3 will not be touched next month. That is a sign, needless to say, of a strong trend, but also another sign the trend has been stretched. It's these conditions that the markets provide some ideal entries for quick pips.

Also, around the corner is something that shows even more the copious amounts of opportunities the markets provide. Sometimes, I am in a position of just trying to make a decision on what pair I want to trade. As an example, isn't it good to know the GBP/CHF is headed back up to the daily tenken at 1.5609. Unbelievable! I might close the NZD/CHF early just to make room for this pair. OTOH, there are many more delicacies on the forex menu.

This is why in order to get the gains I have talked about, the trader needs to have a methodology that will give strong indications of when there is nothing left in a trend.

BTW, the stochastics is an indicator I use, only to show when reversals might happen, but I also use it as a momentum indicator.
 

Attachments

  • audusd 240.jpg
    audusd 240.jpg
    95.9 KB · Views: 229
  • audusd d.jpg
    audusd d.jpg
    74.7 KB · Views: 230
  • audusd w.jpg
    audusd w.jpg
    84.3 KB · Views: 255
Nugget 5--Understanding a trend III

Here's the AUD/USD daily chart, but with the YP--YR1 zone. Simply put it is the yearly open price to my YR1 which is the year's 1st resistance.

I don't use Fibos in my methodology, but I use them in plotting the points between the reference points. After all, it is good to know that if I am only getting a bounce to know where it will end up. Notice the difference between the YP and the YR1. There is 1331 pips between them. That is the year's range. That would mean fro the range to be complete, we would see its completion around the 78.4% mark, which is .9921. Before that happens, watch closely .9739--.9745 level.

Very related to my S&R's are the standard deviation levels. I don't like admitting it, but they may be even better than my S&R's in determining when a trend has been stretched. Watch out, though! They can also be really tricky. More on that next.
 

Attachments

  • audusd d.jpg
    audusd d.jpg
    89.3 KB · Views: 225
Nugget 6

The next thing I'm getting into is something that will surprise a few people. That post will be coming up in the next 24 hours.
The object of this thread is to prove the antagonists and the losers on this site all wrong, which is not hard for me to do. It is a license to fail when you read copouts from ones saying "there is no magic formula", "trading depends on market conditions", etc etc. I didn't make 218% this month (Profit / beginning equity) by making excuses or running opinion polls. I make it by trading according to the exact specifications of my methodology. When I closed the GBP/USD today on the long for +100 pips, that was according to the "exact specifications of my methodology". The peak for the day was only 4 pips beyond that. I have had one losing trade in the last 5 weeks. If I wanted to make excuses or dwell on what has failed, that also would not have happened. I've had one losing week and no losing months since Oct 2007. It is because I trade accoring to the "exact specifications of my methodology".
The essence of what I am saying is simple. I have no motive but to discuss how to be a winner, which further ensconces my way of trading in me. What I hope that will accomplish is for just a few turn a deaf ear to the ones that want you to believe you cannot win in these markets consistently, and feel like all these posts have created some good for humanity. Once I feel my goal and objectives are no longer being accomplished is when I am out of here.
Next up? You gotta love it. Remember 68-95-98-100. Just a sample.
 
Nugget 7

Part of what I believe makes for a successful trading strategy is to have a wherewithal that will allow to determine when a trend is going to reverse or if there is a correction within the trend. Also, so you want to trade the correction, or just wait for it to complete. I mentioned in the previous nugget the way trends can be viewed. After the 5-min chart trends just like the monthly does. The trader needs to be cognizant of the activity on each time frame. Here's a trade I just entered on the EUR/AUD. If you look at my methodology which is the black chart. Notice where the price struggled. That is the 50% mark of the YS1—YS2. (My proprietary levels are available to any who ask.). Also notice how the cloud is descending, and is looking very bearish into the future. The forecast? That's why I like the ichimoku cloud. Price is headed south in the very near future.

For a minute, forget my methodology. After all, this is a thread of ideas. My methodology is not right for all. I just want people to glean what is best for them. Bottom line is, it does not matter what you use to determine the reversal. Just determine it! Afterward, ride it out. It doesn't take too many of these kinds of trades for you to double your account, and that will depend on just how much you use to margin.

Okay, I digressed. The highlight of this nugget goes outside my methodology. An excellent tool that can be used to determine reversals within any time period is the standard deviation. This indicator is actually called the Hurst Bands historic. Not only do they contain the standard deviation (I'll explain more.), but the Hurst (Named after JM Hurst) cyclical decomposition. It shows the path of direction and current momentum of the trend. In other words, look at the daily. Would it not appear the uptrend paddling upstream? What do you think would happen on a reversal? It is going to be a lot easier for this trend to move south with the current, than while it was moving north against the current.

Here's the amazing thing about standard deviations. Take a data set, then apply the SD formula (Which I will give later in this post.). It is a statistical fact that the rule is that 68% of all the data will fall within sigma 1 +/- of the mean. The mean or the median (Mean is the average. Median is the middle number) is the middle line, the thick blue, in this case. 95% of the data falls within the 2. 98% within the 3. And there is still a total of 2% that will find its way beyond the 3. I hope this information is obvious how it adds up in making trading decisions.

It is implied there is a 98% chance of circa 1.4200 being containment. Where will it head once it reverses? The gravitational pull is always to the median. It gets hit 99% of the time once a 2 or 3 has been hit. The thing you must do in trading off the SD charts is to monitor the TF you placed the trade on. This is a daily, at the beginning of the business day, check the chart just to see how close ot the median it has gotten.

Needless to say, it is also best to trade in the direction of the momentous flow. If the chart is pointing south, then it's good to travel south (Better gas mileage that way.) The reason you need to check the charts at the beginning of a new candle is because the SD is dynamic. If the setting is set on 150 candles, then when the 1st one falls off, the 150th is added. This means a new set of data is figured into the equation.

Now for the equation. Apply this to any set of data you wish. Specifically, when you have a favorite market that has trended for a long time, take the previous 100 candles, apply the formula, and see if the numbers do not fall within the parameters given. When you see it has hit sigma 2 get ready for the action in reverse: The sum of the data values (I wish they had the Greek letter sigma on my keyboard.) minus the mean, and then square the result. Afterward divide by the (data values – 1). Once you are done with that, take the square root, and that is you sigma 1 value. The sigma 2 and 3 are equi-distance. A lot of work? Sure! But, we are not talking 5-10 pips per day.
 

Attachments

  • euraud d.png
    euraud d.png
    208.5 KB · Views: 243
  • euraud da.jpg
    euraud da.jpg
    83.3 KB · Views: 233
Nugget 9

I wanted to post this in the form of a nugget, as per the conversation with bbmac.

These are the weeklies for the GBP/USD from last week. The hourly chart is plotted in conjunction with it. The encircled area represents the beginning price action for the week. At the beginning of any TF, price is indecisive. We finally got a break north, but did not make it all the way to the WR1. The level it stopped at was 61.8% of the distance of WP--WR1.

The break south took us to the the WS1 at 1.5730. We had a slight wick spike to 1.5719.
The reversal produced some more consolidative action abck around the WP. One of the trades from last week was entered at the purple line, and exited at the WR1right before we had that sharp break south.

This drives the skeptics nuts. Enter a trade with no pullbacks and bag 100 pips. Check my other trade for confirmation on the posted trade, live. I also posted my S&R's at the beginning of last week, as per request.

There are other instances of a strong trend where there is what I would call a continuation. When my S or R is hit, there would be a hestitation, slight spike, then a move through it. Watch the hourly candle on the weeklies for a close above the R or under the S. Wait for the retrace back near the level and get in the same direction.

Use the 4-hour candle in the same way in viewing the monthliesm and the daily in viewing the yearlies.
 

Attachments

  • gbpusd ws&r's.jpg
    gbpusd ws&r's.jpg
    66.1 KB · Views: 221
This thread isolates the "nuggets" from 4xpipcounter's How to make 100% thread http://www.trade2win.com/boards/general-trading-chat/104620-how-make-100-a.html where those "nuggets are discussed. This thread is a closed thread to give ready reference to those "nuggets" without having to search through the other thread. It does not allow posts and any comments concerning the "nuggets" should be directed to the original thread.

jon
 
Nugget 10-- Quick thought on deviations

I thougbht it might be appropriate to make some addiitonal comments with regards to standard deviations.

There are 2 basic ways to look at them. First, when price reaches the 2 or 3 sigma, it is the obvious ultimate entry to enter a trade. Even at 2, that is the 95% area for all candles from that point to the median. That would also mean there is a 5% chance of it getting on the other side. This applies to any TF. This is why I entered the short on the EUR/AUD. It is very close to the +3. There is only a 2% chance of price going beyond it.

Stock portfolio managers use SD channels much differently. They'll take various groups of stocks, then figure the standard deviation for the howle group of stocks. After analyzing various groups, they will reccomend the group with the lowest rating. Simply put, they want the lowest vairable from the mean. Their methods of investing clients' money is highly conservative. Therefore, have a group os stocks with such a small variance, adn the highly conservative style they have because of the large sums of money they invest, and that all adds up to 15--20% pre year being considered excellent returns.

The readers of this thread wil know why I use deviation channels the way I do, with respect to entering trades when price is out of the ordinary zone, as in the current short I have on the EUR/AUD. Some of you will use that for your benefit. Others will sit on the sidelines as they spue and worry about how much I'm going to "lose" per trade.

My suggestion is to use your method of deciding when your trend has become stretched, enter, and then exit with lots of pips.
 
Nugget 11--Yearly S&R's

The accompanying chart is the GBP/USD daily. It is up-to-date. Notice the activity so far this year. The pink lines are YP, YS1, and YS2. The dotted lines in between are the Fibos between each reference point. It is the only time I use Fibos, which are used in conjunction with my S&R's. Notice the full correction after the YS1 was hit the first time. It hit the 38% line then continued its journey. After the 62% of YS1—YS2 was hit, the subsequent move was to the 62% mark of the YP—YS1. That kind of thing happens a lot, because it represents a full range of the yearly range. That range is the distance between each individual S&R with the absolute values of 2 or less. From 2-3, they are approximately 1.61 (No relation to Fibos) the distance of the P-1 and 1-2 levels. The distance this year for cable is 1,158 pips. Once a one-way trip has been hit, it is time to look for a reversal point.

All my S&R's are highly effective, especially on the initial hit. After 2nd and subsequent hits, they lose their elasticity, and then are not as effective. Even so, look at the price action around the YS1 on all the return trips around it.
When the dip was established at 1.4229 was established, it was evident there was going to be a strong move north. It was in the forecast for a full move of the yearly range to 1.5278. There were strong indications on the weekly for a strong move UP, which is why it is important to pay attention to the other TF's in evaluating a position.

These representations are never meant to be presented as if all those pips were gotten, or should have be gotten on that move or moves. Even with excellent indicators that we all have access to (Not just a few of us like some were trying to intoxicate us to believe.), they can all indicate different things. This is why it is best to find the best combination of indicators that works best for you in order to ascertain your trade entries and exits.
 

Attachments

  • gbpusd ys&r's.jpg
    gbpusd ys&r's.jpg
    82.5 KB · Views: 176
Status
Not open for further replies.
Top