One Eyed Shark, I enjoy your charts, they are very educational and clear. Thanks for sharing.
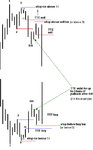
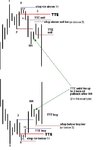
Trying to get the hang of this. Would you mind confirming that this is what you were refering to, or am I seeing thing wrongly? You might in fact be refering to the smaller formation right before what I have marked, different direction?
(Chart is YM 2 mins, the 1-bottom was at 15:12 GMT.
All the best...
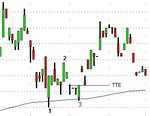
One Eyed Shark said:Nice 123 printed on 2min YM today also confirmed by 5 min @10.00 EST, good for a few points in either timeframe
Trying to get the hang of this. Would you mind confirming that this is what you were refering to, or am I seeing thing wrongly? You might in fact be refering to the smaller formation right before what I have marked, different direction?
(Chart is YM 2 mins, the 1-bottom was at 15:12 GMT.
All the best...