Perfect Wave (SP) - 2010-10

snowrider

Well-known member
Messages
423
Likes
3
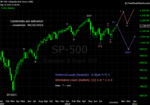
I am starting a new thread for October 2010 with a new name "Perfect Wave". This new thread name might look more powerful than the previous one (i.e., "Wave Count"). My wave counts in last month can be found from:
http://www.trade2win.com/boards/us-indices/102370-sp-wave-count-2010-09-a.html

For the past long term view, please see:
http://www.trade2win.com/boards/us-indices/99196-sp-wave-count.html

Elliott Wave reference can be found from:
http://en.wikipedia.org/wiki/Elliott_wave_principle

My labeling for wave degrees in different time frames:
Monthly – [[]], [[[II]]], [[[III]]], [[[IV]]], [[[V]]], [[[A]]], [[]], [[[C]]]
Monthly – [], [[II]], [[III]], [[IV]], [[V]], [[A]], [], [[C]]
Weekly – , [II], [III], [IV], [V], [A], , [C]
Weekly – I, II, III, IV, V, A, B, C
Daily – 1, 2, 3, 4, 5, a, b, c
Daily – _1, _2, _3, _4, _5, _a, _b, _c
Hourly – __1, __2, __3, __4, __5, __a, __b, __c
 
Weekly

Comments are welcome!
 

Attachments

  • 20100925 SP - Weekly.png
    20100925 SP - Weekly.png
    42.1 KB · Views: 464
Re: Weekly

Comments are welcome!

hey snowrider, here is a question for you, since I cant tell from your charts what your overall wave count is .. on the sp .. if you check the weekly chart, there is a wave 5 just happening right now with the breakout above 1130. I am expecting this to go above 1220 sooner or later.

what you think?
 
Re: Weekly

hey snowrider, here is a question for you, since I cant tell from your charts what your overall wave count is .. on the sp .. if you check the weekly chart, there is a wave 5 just happening right now with the breakout above 1130. I am expecting this to go above 1220 sooner or later.

what you think?

Hi Slight, Yes, I agree with your wave count, and actually I also take that into consideration (see my next post). The reason that my preferred count is a slaughtering wave-C of the big wave-[II] coming is about timespan.

From my weekly chart, if that from 2009-03 to 2010-04 is a big wave- is a correct assumption, the SP 1011 on 07/01 could be the ending point of the big wave-[II]. I prefer to see it as only the wave-A of the big wave-[II] because the amount of time to take to correct the big wave- seems not enough.

If my assumption is correct, then the current breaking out of 1130 is forming a bull trap. I currently holding some long position but with tight stop. I am hopng, but it might not even come, to make an all-in at around 950 if it does happen!
 
Daily

Comments are welcome!
 

Attachments

  • 20100926 SP - Daily.png
    20100926 SP - Daily.png
    52.4 KB · Views: 426
Ah ok I now see what you mean. If wave really has completed and the end of wave [II] correction has also been met, you are now thinking, if it goes up, that it's a weekly wave 3. That is possible as well of course and would bring pretty nice buy signals over some time.

And you are right, if it turns around before much before hitting 1220 it might go waaaay lower. However, I prefer you alternative count and think it's going up with minor corrections in between. The next one might come in a little bit already since I see we could be in a 5th wave on the 4h. We'll see...

Good Trading!
 
hm after this false breakout to the upside this afternoon i wonder if you could be right after all with the bull trap .. will price run back into the sidemove? we'll see.
 
10/02/2010

Comments are welcome!
 

Attachments

  • 20101002 SP - Daily.png
    20101002 SP - Daily.png
    51.7 KB · Views: 499
Don't want to be too picky snow but you can't be far wrong on a forecast of up and down !!

How are you going to decide which is correct AND when ?
 
Don't want to be too picky snow but you can't be far wrong on a forecast of up and down !!

How are you going to decide which is correct AND when ?

he cant, which is way elliot wave is a load of guff. elliot wave only works in hind sight, using it as a prediction is useless because, as shown, it will give several potential "counts" with no way of determining which one its gona be!
 
Don't want to be too picky snow but you can't be far wrong on a forecast of up and down !!

How are you going to decide which is correct AND when ?

Pat - I don't know where the market really wants to go. There are infintely many possible wave count alternatives. I make my wave counts by following Elliott Wave principle with Gann's timing and pricing methodology. My preferred wave count shows how I trade and my current position. If the market proves that my preferred wave count is incorrect, maybe the alternative wave count will take over. The market is always right, so I won't insist where the market should go.
 
Pat - I don't know where the market really wants to go. There are infintely many possible wave count alternatives. I make my wave counts by following Elliott Wave principle with Gann's timing and pricing methodology. My preferred wave count shows how I trade and my current position. If the market proves that my preferred wave count is incorrect, maybe the alternative wave count will take over. The market is always right, so I won't insist where the market should go.

Thanks
I have just downloaded the Elwave free 30 day demo for Metastock. It reckons up both on EOD and on intraday
Could be
 
he cant, which is way elliot wave is a load of guff. elliot wave only works in hind sight, using it as a prediction is useless because, as shown, it will give several potential "counts" with no way of determining which one its gona be!

Agree that I can't really tell where and when the market really wants to go. What I can do is to try my best to *guess*. Trading by using Elliott Wave principle is harder than following some indicators or systems because interpreting a wave structure is an art. However, it still has some basic tenets that one can follow.
 
Complexity is simplified in the following picture.
Current situation is pointing arrow towards the UP side with very good probability.


That’s my 2 cents worth for the day.
 

Attachments

  • spxOct410.jpg
    spxOct410.jpg
    173 KB · Views: 292
Complexity is simplified in the following picture.
Current situation is pointing arrow towards the UP side with very good probability.


That’s my 2 cents worth for the day.

Yes, I agree. I have quit my short position in early session. Now I am in light long.
 
10/09/2010

Comments are welcome!
 

Attachments

  • 20101009 SP - Daily.png
    20101009 SP - Daily.png
    50.6 KB · Views: 1,351
Re: 10/09/2010

Comments are welcome!

NOW I agreee with your preferred count ;) still thinking price is going to hit at least 1220. Friday's close seconds that. We'll see. Weekly is upwards now .. if price keeps rising during the next trading days this is supported as well. Long since 1157,9 ... can't wait to see how it turns out ...

Good Trading!
 
Re: 10/09/2010

hello there, nice to meet U all, im new in this forum may be we can dissccuss about US indexes together.

for next week just watch 1160-1140

UP
1160
FLAT
1140
DOWN
 
10/11/2010

One possible variation of alternative counts is that the wave-C has ended today, which means that a big wave- ended too. And the wave after that is a super big decline of wave-[C] down all the way to 950 area.
 

Attachments

  • 20101011 SP - Intraday.jpg
    20101011 SP - Intraday.jpg
    81.9 KB · Views: 1,129
10/16/2010

Comments are welcome!
 

Attachments

  • 20101016 SP - Daily.png
    20101016 SP - Daily.png
    49.8 KB · Views: 920
Top