Moving averages and their crossovers or crossovers with indicators are widely used in trading and
technical analysis. Shorter averages above longer averages or closing prices above them suggest an uptrend. An indicator below its moving average is a sign of a downtrend. It would be beneficial for a
trader to develop a technique to predict the closing price which will generate a crossover of averages as described above. This article introduces such an anticipation technique, based on moving averages, to determine the future closing price for which a
trend change is possible.
Let's look at figure 1 representing the German
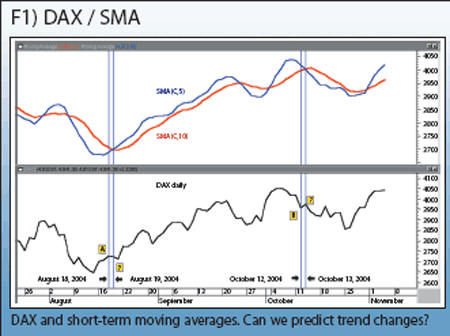
DAX index. Subchart 1 contains two simple moving averages: 5- and 10-day, SMA5 and SMA10. It is well-known among traders that SMA5 > SMA10 corresponds to a short-term uptrend, while SMA5 < SMA10 suggests a short-term downtrend. At point (A) on 18/8/2004, DAX was in a
downtrend as defined by the above-mentioned criterion. That day, an inquisitive trader could have asked: "What will the
close at the end of the next trading day be, in order to have SMA5 above SMA10, and a change of the short-term trend? Can we predict next day's close to meet this requirement"? The same question can be asked in (B) with DAX in a short
uptrend: "How should DAX close tomorrow, 13/10/2004, to trigger SMA5 below SMA10"?
The whole idea with this technique is to be prepared for a trend change in a
risk-controlled manner.
The technique we are going to describe will take into account simple moving averages and two common scenarios found on any chart:
It can be applied to other averages or to indicators and their moving averages.
5- and 10-day golden and dead crosses
Figure 2 shows Vodafone during November 2003 and May 2004. Between (A) and (B) the stock was in a downtrend defined by SMA(C,5) < SMA(C,10). The shorts had a good time, but the longs were impatient to take control and enter the market. They knew that a
golden cross defined by SMA(C,5) breaking above SMA(C,10) would be an entry signal, but they did not know when it would occur.
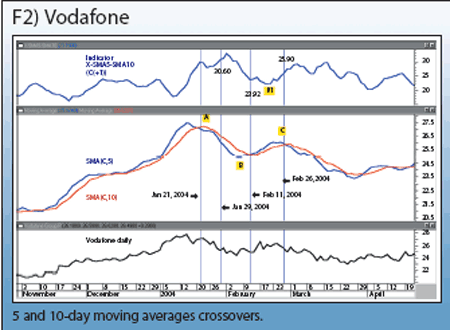
In retrospect, that point in time was (B) with the following condition met:
SMA(C,5) > SMA(C,10) (condition 1)
Let's expand both moving averages:
SMA(C,5) = (C+C(-1)+C(-2)+C(-3)+C(-4))/5
(the sum of the past five closing prices, including the current one, divided by five)
SMA(C,10) = (C+C(-1)+C(-2)+C(-3)+C(-4)+C(-5)+C(-6)+C(-7)+C(-
8)+C(-9))/10
(the sum of the past ten closing prices, including the current one, divided by 10)
After simple algebraic operations and extracting C, condition 1 is reduced to
C > (C(-5)+C(-6)+C(-7)+C(-8)+C(-9)) - (C(-1)+C(-2)+C(-3)+C(-4))
With this anticipation technique in mind, C is in fact the close tomorrow C(+1) which makes condition 1 true. In this case the above formula translates into
C(+1) > (C(-4)+C(-5)+C(-6)+C(-7)+C(-8)) - (C+C(-1)+C(-2)+C(-3))
How can we translate it into plain language?
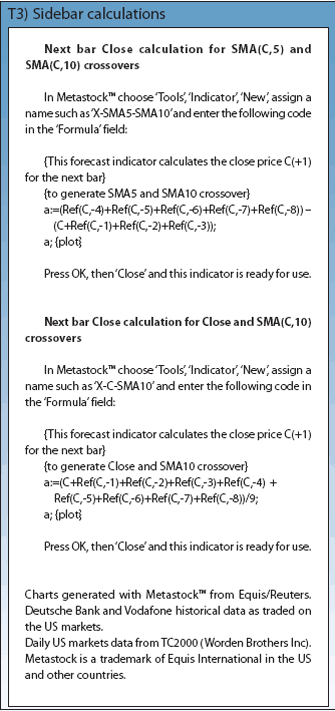
The sidebar contains the calculation of a
Metastock indicator, X-SMA5-SMA10, which computes and displays C(+1) for the next bar (in our case, for the next trading day).
Case study - Vodafone
We consider the Vodafone chart again and discuss the technique during period (A)-(B). The downtrend starts at (A) on January 21, 2004. That day, SMA(C,5) goes below SMA(C,10). The shorts are in charge as long as the two averages remain in this sequence. Subchart 1 displays X-SMA5-SMA10 indicator which calculates the next bar's close in order to change the current trend. During the downtrend, we reach January 29 and the longs are asking: "At or above which value should the close be on the next trading day, January 30, to have SMA5 above SMA10"? To find the answer traders consult indicator X-SMA5-SMA10 and get a reading of 30.60. One day later, Vodafone closes at 25.60 which is far from 30.60, so the longs must postpone their bullish action.
Markets go in cycles so we get closer to a bottom. On February 11 Vodafone is still in a downtrend and the longs are asking the same question. They refer to the indicator in sub-chart 1 and the answer for the next trading day, February 12, is 23.92. The bulls feel that this price can be reached. On the 12th the close was 24.91 which made SMA5 go above SMA10 and signalled a trend change. The bulls were happy... and on that day they should have had two options: (1) to enter half an hour before the market's close if the price was >23.92 or (2) to defer their entry for February 13 at the open if the price closed >23.92. The first choice would have been better.
The segment (B)-(C) was an uptrend with SMA5 > SMA10. Shorts were contemplating an entry but looking at X-SMA5-SMA10 in subchart1, they saw that the right moment was not there. During the uptrend, they noticed a bottom of the indicator in B1 and they realised that the trend was going to change shortly. On February 26 the close was 25.60 and the required close value for February 27 was less than 25.90 in order to change the trend. The close on the 27th was 24.97; everything was going as the shorts wanted and SMA5 went below SMA10.
The closing price and its 10-day average
The anticipation technique described above can be also applied for the close and its 10-day simple moving average. Figure 3 shows Deutsche Bank during June and December 2002. Between (A) and (B) the stock was in an uptrend defined by C > SMA(C,10). The longs were in charge, but the shorts were ready to take again advantage of the overall bearish market. That moment would have been with Deutsche Bank closing below its SMA(C,10).
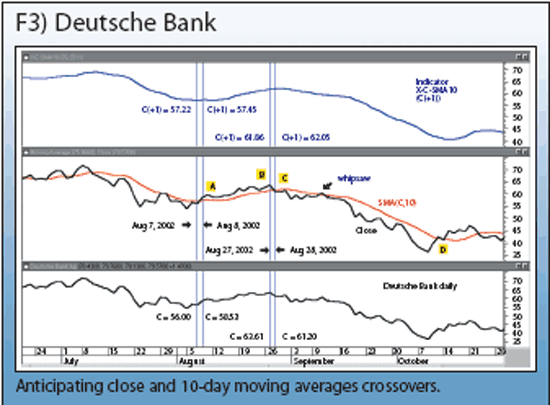
Looking in retrospect, that point in time was C with C C SMA(C,10) (condition 2) met.
Now let's expand the right term of condition 2. SMA(C,10) = (C+C(-1)+C(-2)+C(-3)+C(-4)+C(-5)+C(-6)+C(-7)+C(-8)+C(-9))/10 (sum of the past ten bars, including the current one, divided by 10)
After simple algebraic operations and extracting C, condition 2 is reduced to
C < (C(-1)+C(-2)+C(-3)+C(-4)+C(-5)+C(-6)+C(-7)+C(-8)+C(-9))/9
Shifting everything one day, C is in fact the close tomorrow C(+1) (or for the next bar) which makes condition 2 true. With this adjustment in mind, the above formula translates into:
C(+1) < (C+C(-1)+C(-2)+C(-3)+C(-4)+C(-5)+C(-6)+C(-7)+C(-8))/9
How can we translate this formula?
The sidebar contains the calculation of a Metastock indicator, X-C-SMA10, which computes and displays C(+1) expected to change the shortterm trend defined by crossovers of close and its 10-day moving average. Table 2 outlines all steps taken during period (A)-(B) until a bearish crossover occurred in (C). It also shows where and how the
trader would have taken advantage of this technique.
Step-by-step
The best way to understand this technique is to outline a roadmap and see how it works for a sequence of trading days.
Step 1: Use your technical analysis software to define the two indicators described here, X-SMA5-SMA10 and X-C-SMA10
Step2: Build a screen containing [at least] the following views:
Step 3: Define your next action, either enter long (exit short) or exit long (enter short), based on the positions of the pairs (SMA5, SMA10) or (C, SMA10).
Step 4: In a downtrend defined as SMA5 < SMA10, check daily the forecast indicator displayed in view 1. If it approaches a top, the price may soon be close to a bottom and you should consider preparing a long entry at a value which is greater than the one shown by the indicator. Consider the initial stop-loss as the recent price low. Once in a long position, implement a trailing stop equal to C(+1) or based on volatility (ATR).
Step 5: In an uptrend defined SMA5 > SMA10, check daily the forecast indicator displayed in view 1. If it approaches a bottom, the price may soon be close to a top and you should consider preparing for a long exit at a value which is less than the one shown by the indicator.
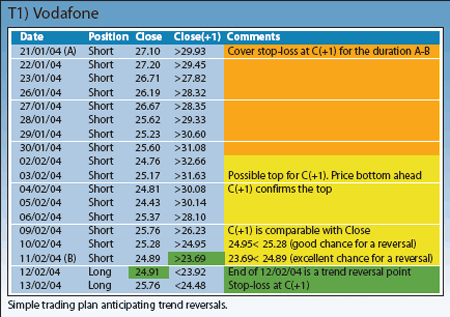
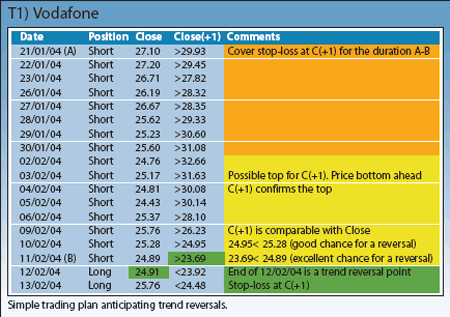
To illustrate all these steps, let's create an action table during the downtrend (A)-(B) for Vodafone. We will monitor on a daily basis the anticipated close for the next trading day, C(+1) which may change the trend from descending to ascending.
How could we have taken advantage of the anticipation signal on 11/02/04? During the last half hour of trading, we were facing a decision about whether to enter long positions or to delay the entry for the next day. With an update of the indicator X-SMA5-SMA10 during the last 30 minutes of trade, C(+1) would have read a value greater than 23.69 for the next day. Comparing this value with the pre-close of around 24.89, the chance for a trend change would have been excellent and we could have been in anticipation of the crossover. Another entry would have been at the open of 12/2/04. The final confirmation came at the end of 12/2/04. Sometimes when signals are strong it is a good idea to participate with small positions (end of 11/2/04) until a full confirmation (end of 12/2/04) occurs.
Now, let's apply the same procedure for Deutsche Bank during the period 7/08/02 - 30/08/02.
In the case of these crossovers, the situation is a little different. The lows and peaks of X-C-SMA10 do not anticipate tops and bottoms for the price. The days prior to the trend confirmation, 07/08 and 28/08, do not allow accumulation based on the probability that the price the next day would meet the targets indicated by C(+1). This scenario works best using confirmations at the end of days of trend reversals like (C).
Conclusion
This technique is simple and can be implemented by any trader who works with moving averages. It can be used in any timeframe, with various periods, and with all trading instruments. In the case of SMA5 and SMA10 crossovers, the forecast indicator displays very useful information by forecasting minor tops and bottoms for the price. A bottom, respectively top of the indicator announces a top, respectively a bottom of the price. The values computed by the forecast indicators can also be used as stop-loss or cover stop-loss.
Since moving averages are taken into account, there are delays for the crossovers. They can be reduced by using zero-lag averages, but in this case, the calculation of C(+1) may become more complex, yet more rewarding. Other areas to develop this technique for are
crossovers of indicators and their moving averages. An immediate example is the forecast of closing prices to generate
MACD crossovers.
If your trading platform allows for the building of custom indicators, then you can apply this technique in a real-time environment. Everything depends on some basic algebra and willingness to "beat the system".
technical analysis. Shorter averages above longer averages or closing prices above them suggest an uptrend. An indicator below its moving average is a sign of a downtrend. It would be beneficial for a
trader to develop a technique to predict the closing price which will generate a crossover of averages as described above. This article introduces such an anticipation technique, based on moving averages, to determine the future closing price for which a
trend change is possible.

Let's look at figure 1 representing the German
DAX index. Subchart 1 contains two simple moving averages: 5- and 10-day, SMA5 and SMA10. It is well-known among traders that SMA5 > SMA10 corresponds to a short-term uptrend, while SMA5 < SMA10 suggests a short-term downtrend. At point (A) on 18/8/2004, DAX was in a
downtrend as defined by the above-mentioned criterion. That day, an inquisitive trader could have asked: "What will the
close at the end of the next trading day be, in order to have SMA5 above SMA10, and a change of the short-term trend? Can we predict next day's close to meet this requirement"? The same question can be asked in (B) with DAX in a short
uptrend: "How should DAX close tomorrow, 13/10/2004, to trigger SMA5 below SMA10"?
The whole idea with this technique is to be prepared for a trend change in a
risk-controlled manner.
The technique we are going to describe will take into account simple moving averages and two common scenarios found on any chart:
- Crossovers of SMA(C,5) and SMA(C,10)
- Crossovers of Close and SMA(C,10)
It can be applied to other averages or to indicators and their moving averages.
5- and 10-day golden and dead crosses
Figure 2 shows Vodafone during November 2003 and May 2004. Between (A) and (B) the stock was in a downtrend defined by SMA(C,5) < SMA(C,10). The shorts had a good time, but the longs were impatient to take control and enter the market. They knew that a
golden cross defined by SMA(C,5) breaking above SMA(C,10) would be an entry signal, but they did not know when it would occur.

In retrospect, that point in time was (B) with the following condition met:
SMA(C,5) > SMA(C,10) (condition 1)
Let's expand both moving averages:
SMA(C,5) = (C+C(-1)+C(-2)+C(-3)+C(-4))/5
(the sum of the past five closing prices, including the current one, divided by five)
SMA(C,10) = (C+C(-1)+C(-2)+C(-3)+C(-4)+C(-5)+C(-6)+C(-7)+C(-
8)+C(-9))/10
(the sum of the past ten closing prices, including the current one, divided by 10)
After simple algebraic operations and extracting C, condition 1 is reduced to
C > (C(-5)+C(-6)+C(-7)+C(-8)+C(-9)) - (C(-1)+C(-2)+C(-3)+C(-4))
With this anticipation technique in mind, C is in fact the close tomorrow C(+1) which makes condition 1 true. In this case the above formula translates into
C(+1) > (C(-4)+C(-5)+C(-6)+C(-7)+C(-8)) - (C+C(-1)+C(-2)+C(-3))
How can we translate it into plain language?
- In a downtrend and to change it, the close of the next bar, C(+1), must be greater than the sum (C(-4)+C(-5)+C(-6)+C(-7)+C(-8)) - (C+C(-1)+C(-2)+C(-3))
- In an uptrend and to change it, the close of the next bar, C(+1), must be less than the sum (C(-4)+C(-5)+C(-6)+C(-7)+C(-8)) - (C+C(-1)+C(-2)+C(-3))
The sidebar contains the calculation of a
Metastock indicator, X-SMA5-SMA10, which computes and displays C(+1) for the next bar (in our case, for the next trading day).
Case study - Vodafone
We consider the Vodafone chart again and discuss the technique during period (A)-(B). The downtrend starts at (A) on January 21, 2004. That day, SMA(C,5) goes below SMA(C,10). The shorts are in charge as long as the two averages remain in this sequence. Subchart 1 displays X-SMA5-SMA10 indicator which calculates the next bar's close in order to change the current trend. During the downtrend, we reach January 29 and the longs are asking: "At or above which value should the close be on the next trading day, January 30, to have SMA5 above SMA10"? To find the answer traders consult indicator X-SMA5-SMA10 and get a reading of 30.60. One day later, Vodafone closes at 25.60 which is far from 30.60, so the longs must postpone their bullish action.
Markets go in cycles so we get closer to a bottom. On February 11 Vodafone is still in a downtrend and the longs are asking the same question. They refer to the indicator in sub-chart 1 and the answer for the next trading day, February 12, is 23.92. The bulls feel that this price can be reached. On the 12th the close was 24.91 which made SMA5 go above SMA10 and signalled a trend change. The bulls were happy... and on that day they should have had two options: (1) to enter half an hour before the market's close if the price was >23.92 or (2) to defer their entry for February 13 at the open if the price closed >23.92. The first choice would have been better.
The segment (B)-(C) was an uptrend with SMA5 > SMA10. Shorts were contemplating an entry but looking at X-SMA5-SMA10 in subchart1, they saw that the right moment was not there. During the uptrend, they noticed a bottom of the indicator in B1 and they realised that the trend was going to change shortly. On February 26 the close was 25.60 and the required close value for February 27 was less than 25.90 in order to change the trend. The close on the 27th was 24.97; everything was going as the shorts wanted and SMA5 went below SMA10.
The closing price and its 10-day average
The anticipation technique described above can be also applied for the close and its 10-day simple moving average. Figure 3 shows Deutsche Bank during June and December 2002. Between (A) and (B) the stock was in an uptrend defined by C > SMA(C,10). The longs were in charge, but the shorts were ready to take again advantage of the overall bearish market. That moment would have been with Deutsche Bank closing below its SMA(C,10).

Looking in retrospect, that point in time was C with C C SMA(C,10) (condition 2) met.
Now let's expand the right term of condition 2. SMA(C,10) = (C+C(-1)+C(-2)+C(-3)+C(-4)+C(-5)+C(-6)+C(-7)+C(-8)+C(-9))/10 (sum of the past ten bars, including the current one, divided by 10)
After simple algebraic operations and extracting C, condition 2 is reduced to
C < (C(-1)+C(-2)+C(-3)+C(-4)+C(-5)+C(-6)+C(-7)+C(-8)+C(-9))/9
Shifting everything one day, C is in fact the close tomorrow C(+1) (or for the next bar) which makes condition 2 true. With this adjustment in mind, the above formula translates into:
C(+1) < (C+C(-1)+C(-2)+C(-3)+C(-4)+C(-5)+C(-6)+C(-7)+C(-8))/9
How can we translate this formula?
- In a downtrend and to change it, the close next bar C(+1) must be greater than the sum (C+C(-1)+C(-2)+C(-3)+C(-4)+C(-5)+C(-6)+C(-7)+C(-8)) divided by 9
- In an uptrend and to change it, the close next bar C(+1) must be less than the sum (C+C(-1)+C(-2)+C(-3)+C(-4)+C(-5)+C(-6)+C(-7)+C(-8)) divided by 9
The sidebar contains the calculation of a Metastock indicator, X-C-SMA10, which computes and displays C(+1) expected to change the shortterm trend defined by crossovers of close and its 10-day moving average. Table 2 outlines all steps taken during period (A)-(B) until a bearish crossover occurred in (C). It also shows where and how the
trader would have taken advantage of this technique.
Step-by-step
The best way to understand this technique is to outline a roadmap and see how it works for a sequence of trading days.

Step 1: Use your technical analysis software to define the two indicators described here, X-SMA5-SMA10 and X-C-SMA10
Step2: Build a screen containing [at least] the following views:
- View 1: X-SMA5-SMA10 or X-C-SMA10
- View 2: Price displayed as a line graph, SMA5, and SMA10
- View 3: (optional) another indicator, preferably Bollinger bands, Z-score,
ADX, or any other of your choice. This will be used as a second opinion to avoid possible whipsaws due to the short-term periods for the averages
Step 3: Define your next action, either enter long (exit short) or exit long (enter short), based on the positions of the pairs (SMA5, SMA10) or (C, SMA10).
Step 4: In a downtrend defined as SMA5 < SMA10, check daily the forecast indicator displayed in view 1. If it approaches a top, the price may soon be close to a bottom and you should consider preparing a long entry at a value which is greater than the one shown by the indicator. Consider the initial stop-loss as the recent price low. Once in a long position, implement a trailing stop equal to C(+1) or based on volatility (ATR).
Step 5: In an uptrend defined SMA5 > SMA10, check daily the forecast indicator displayed in view 1. If it approaches a bottom, the price may soon be close to a top and you should consider preparing for a long exit at a value which is less than the one shown by the indicator.
To illustrate all these steps, let's create an action table during the downtrend (A)-(B) for Vodafone. We will monitor on a daily basis the anticipated close for the next trading day, C(+1) which may change the trend from descending to ascending.
How could we have taken advantage of the anticipation signal on 11/02/04? During the last half hour of trading, we were facing a decision about whether to enter long positions or to delay the entry for the next day. With an update of the indicator X-SMA5-SMA10 during the last 30 minutes of trade, C(+1) would have read a value greater than 23.69 for the next day. Comparing this value with the pre-close of around 24.89, the chance for a trend change would have been excellent and we could have been in anticipation of the crossover. Another entry would have been at the open of 12/2/04. The final confirmation came at the end of 12/2/04. Sometimes when signals are strong it is a good idea to participate with small positions (end of 11/2/04) until a full confirmation (end of 12/2/04) occurs.
Now, let's apply the same procedure for Deutsche Bank during the period 7/08/02 - 30/08/02.

In the case of these crossovers, the situation is a little different. The lows and peaks of X-C-SMA10 do not anticipate tops and bottoms for the price. The days prior to the trend confirmation, 07/08 and 28/08, do not allow accumulation based on the probability that the price the next day would meet the targets indicated by C(+1). This scenario works best using confirmations at the end of days of trend reversals like (C).
Conclusion
This technique is simple and can be implemented by any trader who works with moving averages. It can be used in any timeframe, with various periods, and with all trading instruments. In the case of SMA5 and SMA10 crossovers, the forecast indicator displays very useful information by forecasting minor tops and bottoms for the price. A bottom, respectively top of the indicator announces a top, respectively a bottom of the price. The values computed by the forecast indicators can also be used as stop-loss or cover stop-loss.
Since moving averages are taken into account, there are delays for the crossovers. They can be reduced by using zero-lag averages, but in this case, the calculation of C(+1) may become more complex, yet more rewarding. Other areas to develop this technique for are
crossovers of indicators and their moving averages. An immediate example is the forecast of closing prices to generate
MACD crossovers.
If your trading platform allows for the building of custom indicators, then you can apply this technique in a real-time environment. Everything depends on some basic algebra and willingness to "beat the system".

Last edited by a moderator:
